
Notes
Unless this report indicates otherwise, all years referred to are federal fiscal years, which run from October 1 to September 30 and are designated by the calendar year in which they end. Numbers in the text, tables, and figures may not add up to totals because of rounding. Budget estimates correspond to those published in CBO’s February 2023 report The Budget and Economic Outlook: 2023 to 2033.
Federal revenues and outlays regularly respond to cyclical movements in the economy in ways that tend to offset those movements; the budget mechanisms that drive that process are known as automatic stabilizers. Those mechanisms, which help stabilize the economy automatically, also contribute to short-run fluctuations in the deficit, without any legislated changes in tax or spending policies.
In this report, the Congressional Budget Office projects the budgetary effects of those automatic stabilizers—as well as the size of deficits without them—from 2023 to 2033 and provides historical estimates of the stabilizers’ effects since 1973.1 This report is based on CBO’s forecast that was released in February 2023; those economic projections reflect economic developments through December 6, 2022. The projections in the February 2023 forecast and those presented in this report reflect the assumption that current law will generally remain unchanged.2
The key takeaways from CBO’s analysis of the effects of automatic stabilizers are as follows:
- Automatic stabilizers are projected to increase federal deficits from 2023 to 2027. From 2028 to 2033, automatic stabilizers continue to add to deficits in CBO’s projections, but by a smaller amount than they do over the next five years.
- With the effect of automatic stabilizers removed, deficits are projected to average 5.5 percent of potential gross domestic product (GDP) over the next decade, roughly double their 50-year average. (Potential GDP is an estimate of the maximum sustainable output of the economy.)
Background
When the unemployment rate is above the noncyclical rate of unemployment, automatic stabilizers typically boost federal outlays for transfer programs above what they would be if the unemployment rate was equal to the noncyclical rate. Those programs include unemployment insurance benefits, Medicaid, and the Supplemental Nutrition Assistance Program (SNAP); such programs support household income and thus private spending. Meanwhile, automatic stabilizers tend to reduce federal revenues when output is below its potential, because wages and salaries, corporate profits, and other tax bases are typically smaller than they would be at potential output. By contrast, when unemployment is below its noncyclical rate and output is above its potential, automatic stabilizers generally decrease federal spending on transfer programs and increase revenues relative to what they would be otherwise, thus restraining private spending.
CBO estimates the effects of automatic stabilizers on spending and revenues to inform policymakers and analysts about the extent to which changes in the budget deficit are caused by cyclical fluctuations in the economy rather than policy changes. The effects of automatic stabilizers are measured as the estimated changes in federal revenues and outlays—and thus in federal budget deficits—stemming from the cyclical components of GDP and the unemployment rate.3 Those cyclical components are the output gap, which is the difference between GDP and potential GDP, and the unemployment gap, which is the difference between the rate of unemployment and the noncyclical rate of unemployment.
Estimates of the Effects of Automatic Stabilizers Over the Next Decade
Using its February 2023 budget and economic projections, CBO estimates that from 2023 through 2033, automatic stabilizers would increase federal budget deficits by an average of 0.4 percent of potential GDP if current laws generally remained unchanged. By comparison, automatic stabilizers added an average of 0.6 percent of potential GDP to deficits over the past 50 years. The projected average is slightly lower because the contribution of automatic stabilizers to deficits is expected to decrease to its long-run value by 2028.
In CBO’s current economic forecast, GDP continues to fall short of its potential, but the output gap increases to its long-run value by 2028. Similarly, the unemployment gap is positive from 2024 to 2033, falling to its long-run value by 2029. Because of those cyclical factors, outlays for unemployment insurance, Medicaid, and SNAP are projected to be larger, and tax revenues are projected to be smaller, than they would be otherwise. Thus, automatic stabilizers would increase deficits from 2023 through 2033. In 2024, for example, when the output gap reaches a cyclical trough, automatic stabilizers are projected to increase the deficit by $290 billion, or 1.0 percent of potential GDP (see Table 1 and see Table 2).4 From 2028 to 2033, automatic stabilizers increase annual deficits by an average of 0.2 percent of potential GDP as the projected output and unemployment gaps begin to settle at their long-run average values of −0.5 percent and 0.2 percent, respectively (see Figure 1).5
Table 1.
Deficit or Surplus With and Without CBO’s Estimate of Automatic Stabilizers, in Billions of Dollars
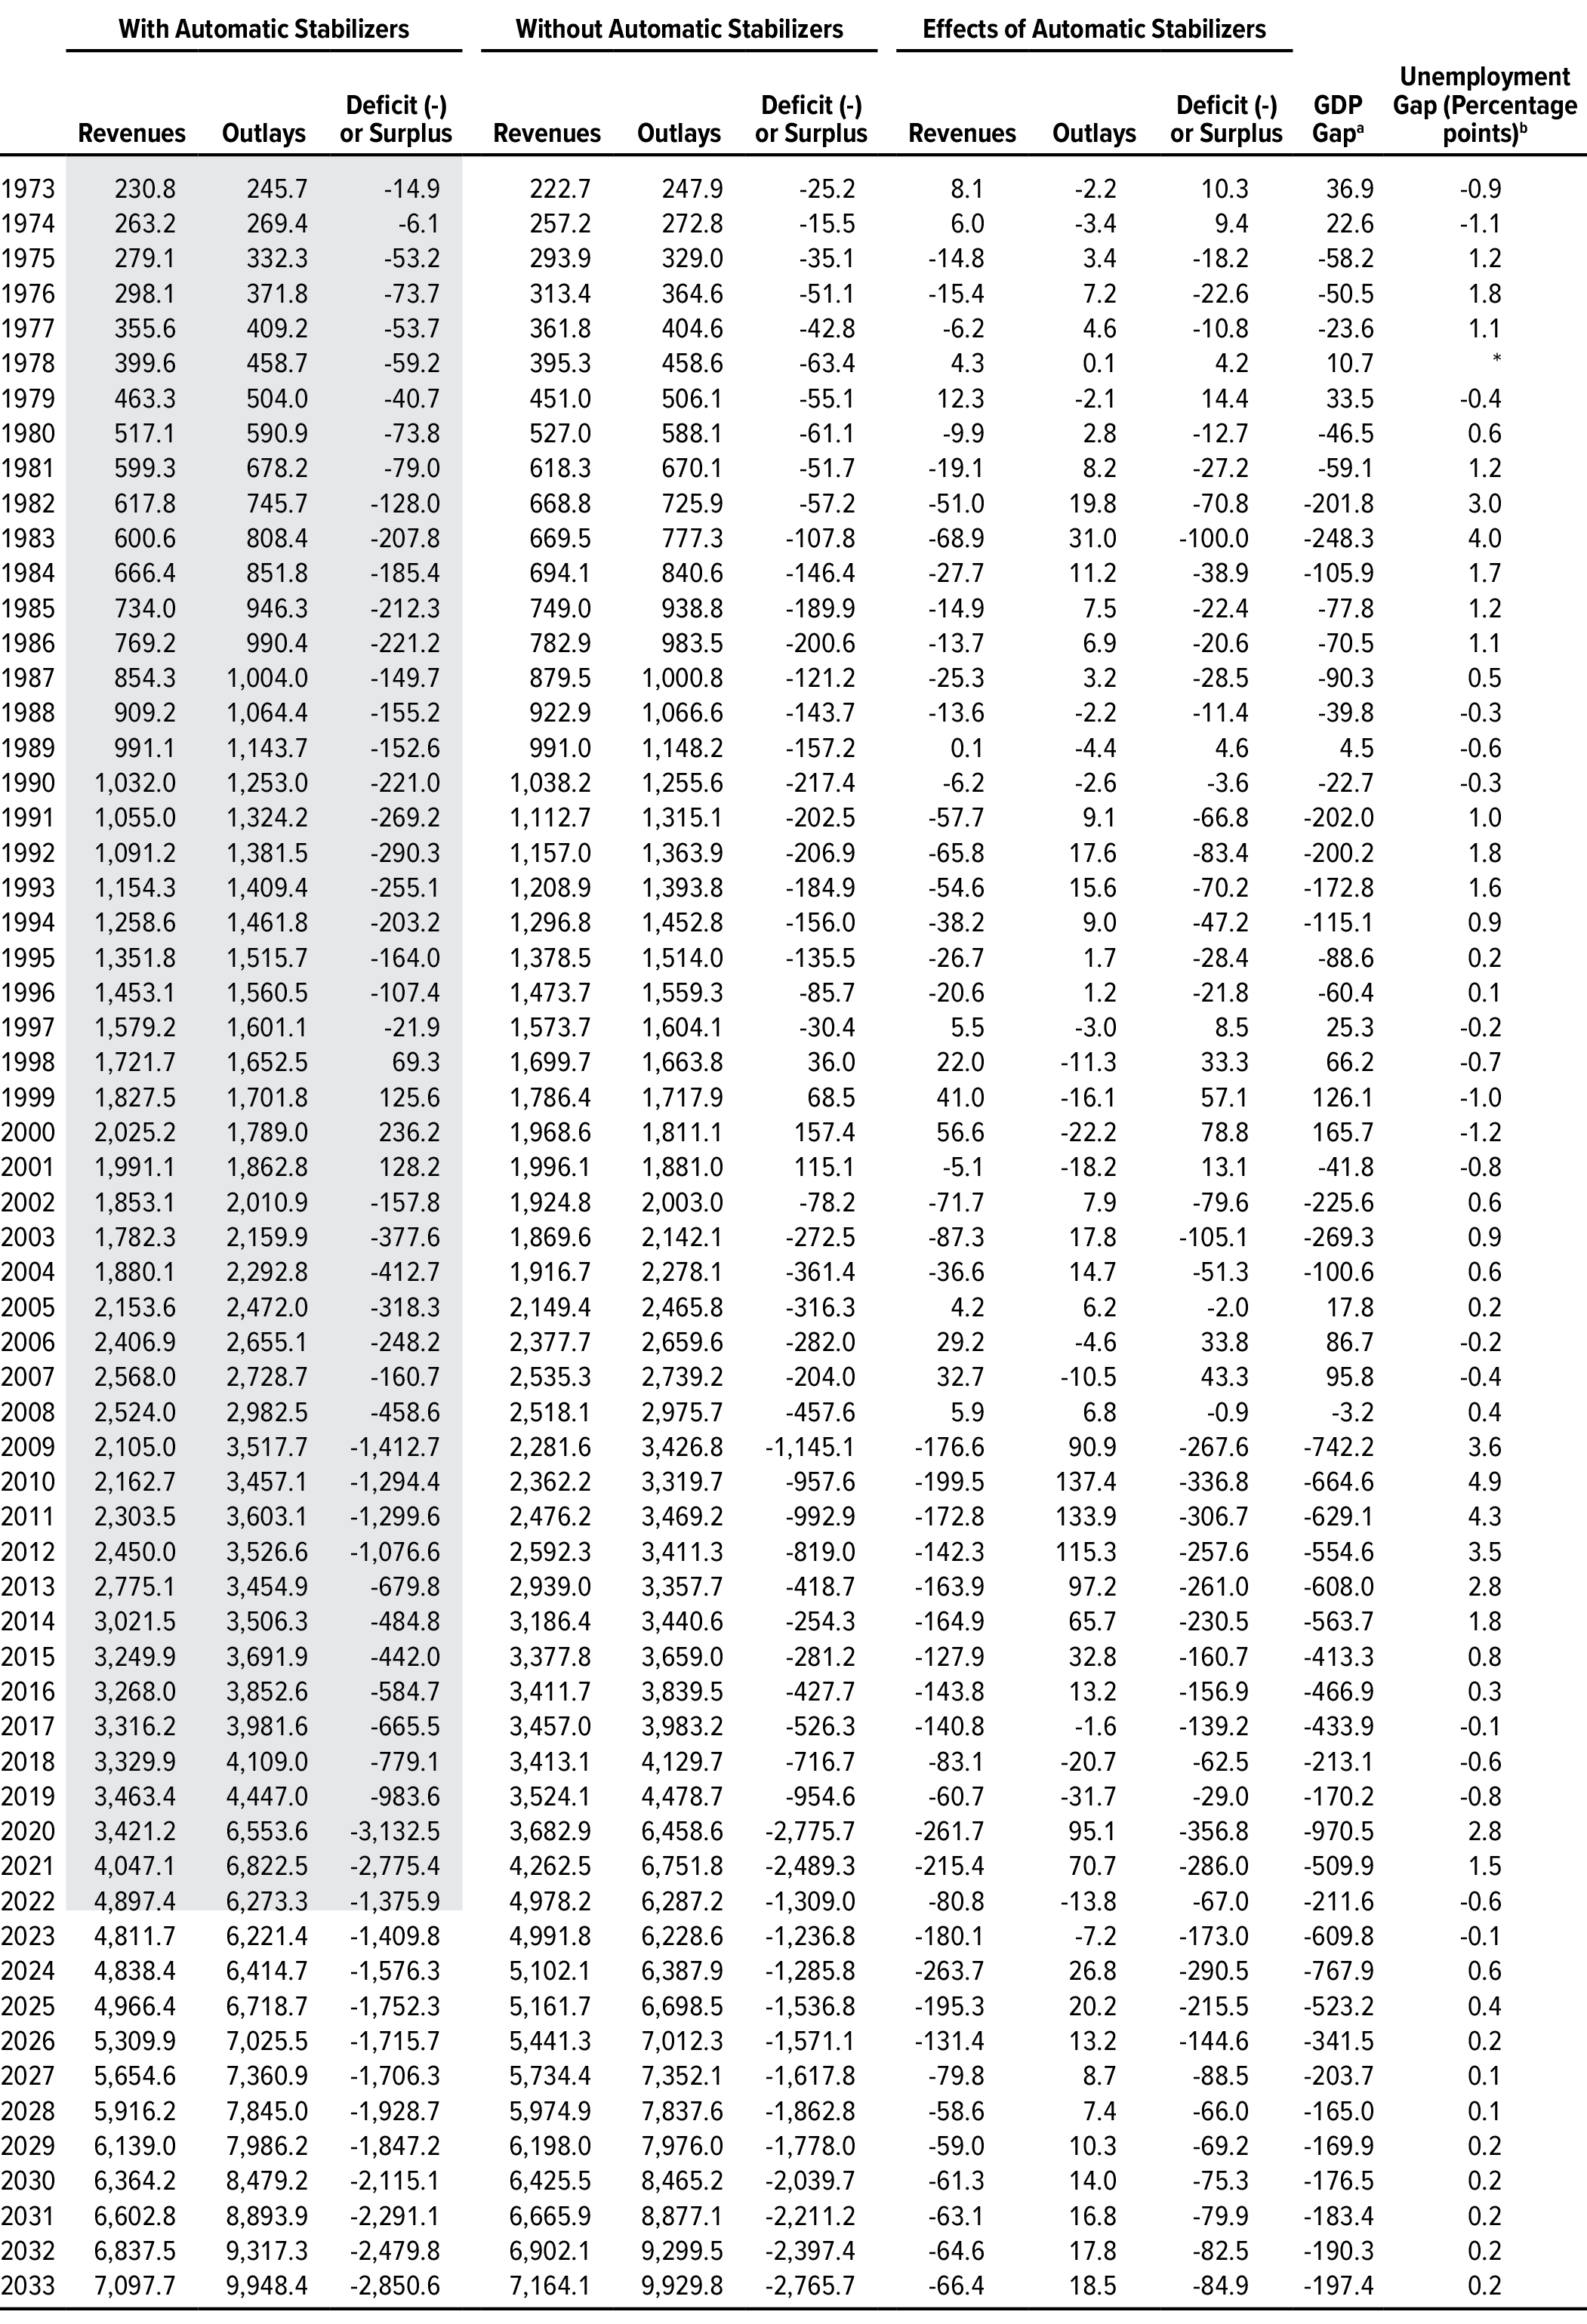
Data sources: Congressional Budget Office; Office of Management and Budget. See www.cbo.gov/publication/59114#data.
Automatic stabilizers are budget mechanisms that automatically help stabilize the economy by changing revenues and outlays in response to cyclical movements in GDP and unemployment.
Shaded values are actual amounts.
Projected deficits with automatic stabilizers are CBO’s current baseline projections of the federal budget deficit as presented in Congressional Budget Office, The Budget and Economic Outlook: 2023 to 2033 (February 2023), www.cbo.gov/publication/58848.
GDP = gross domestic product; * = between -0.05 percentage points and 0.05 percentage points.
a. The GDP gap equals the difference between actual or projected GDP and CBO’s estimate of potential GDP (the maximum sustainable output of the economy).
b. The unemployment gap equals the actual or projected rate of unemployment minus CBO’s estimate of the noncyclical rate of unemployment.
Table 2.
Deficit or Surplus With and Without CBO’s Estimate of Automatic Stabilizers, as a Percentage of Potential GDP
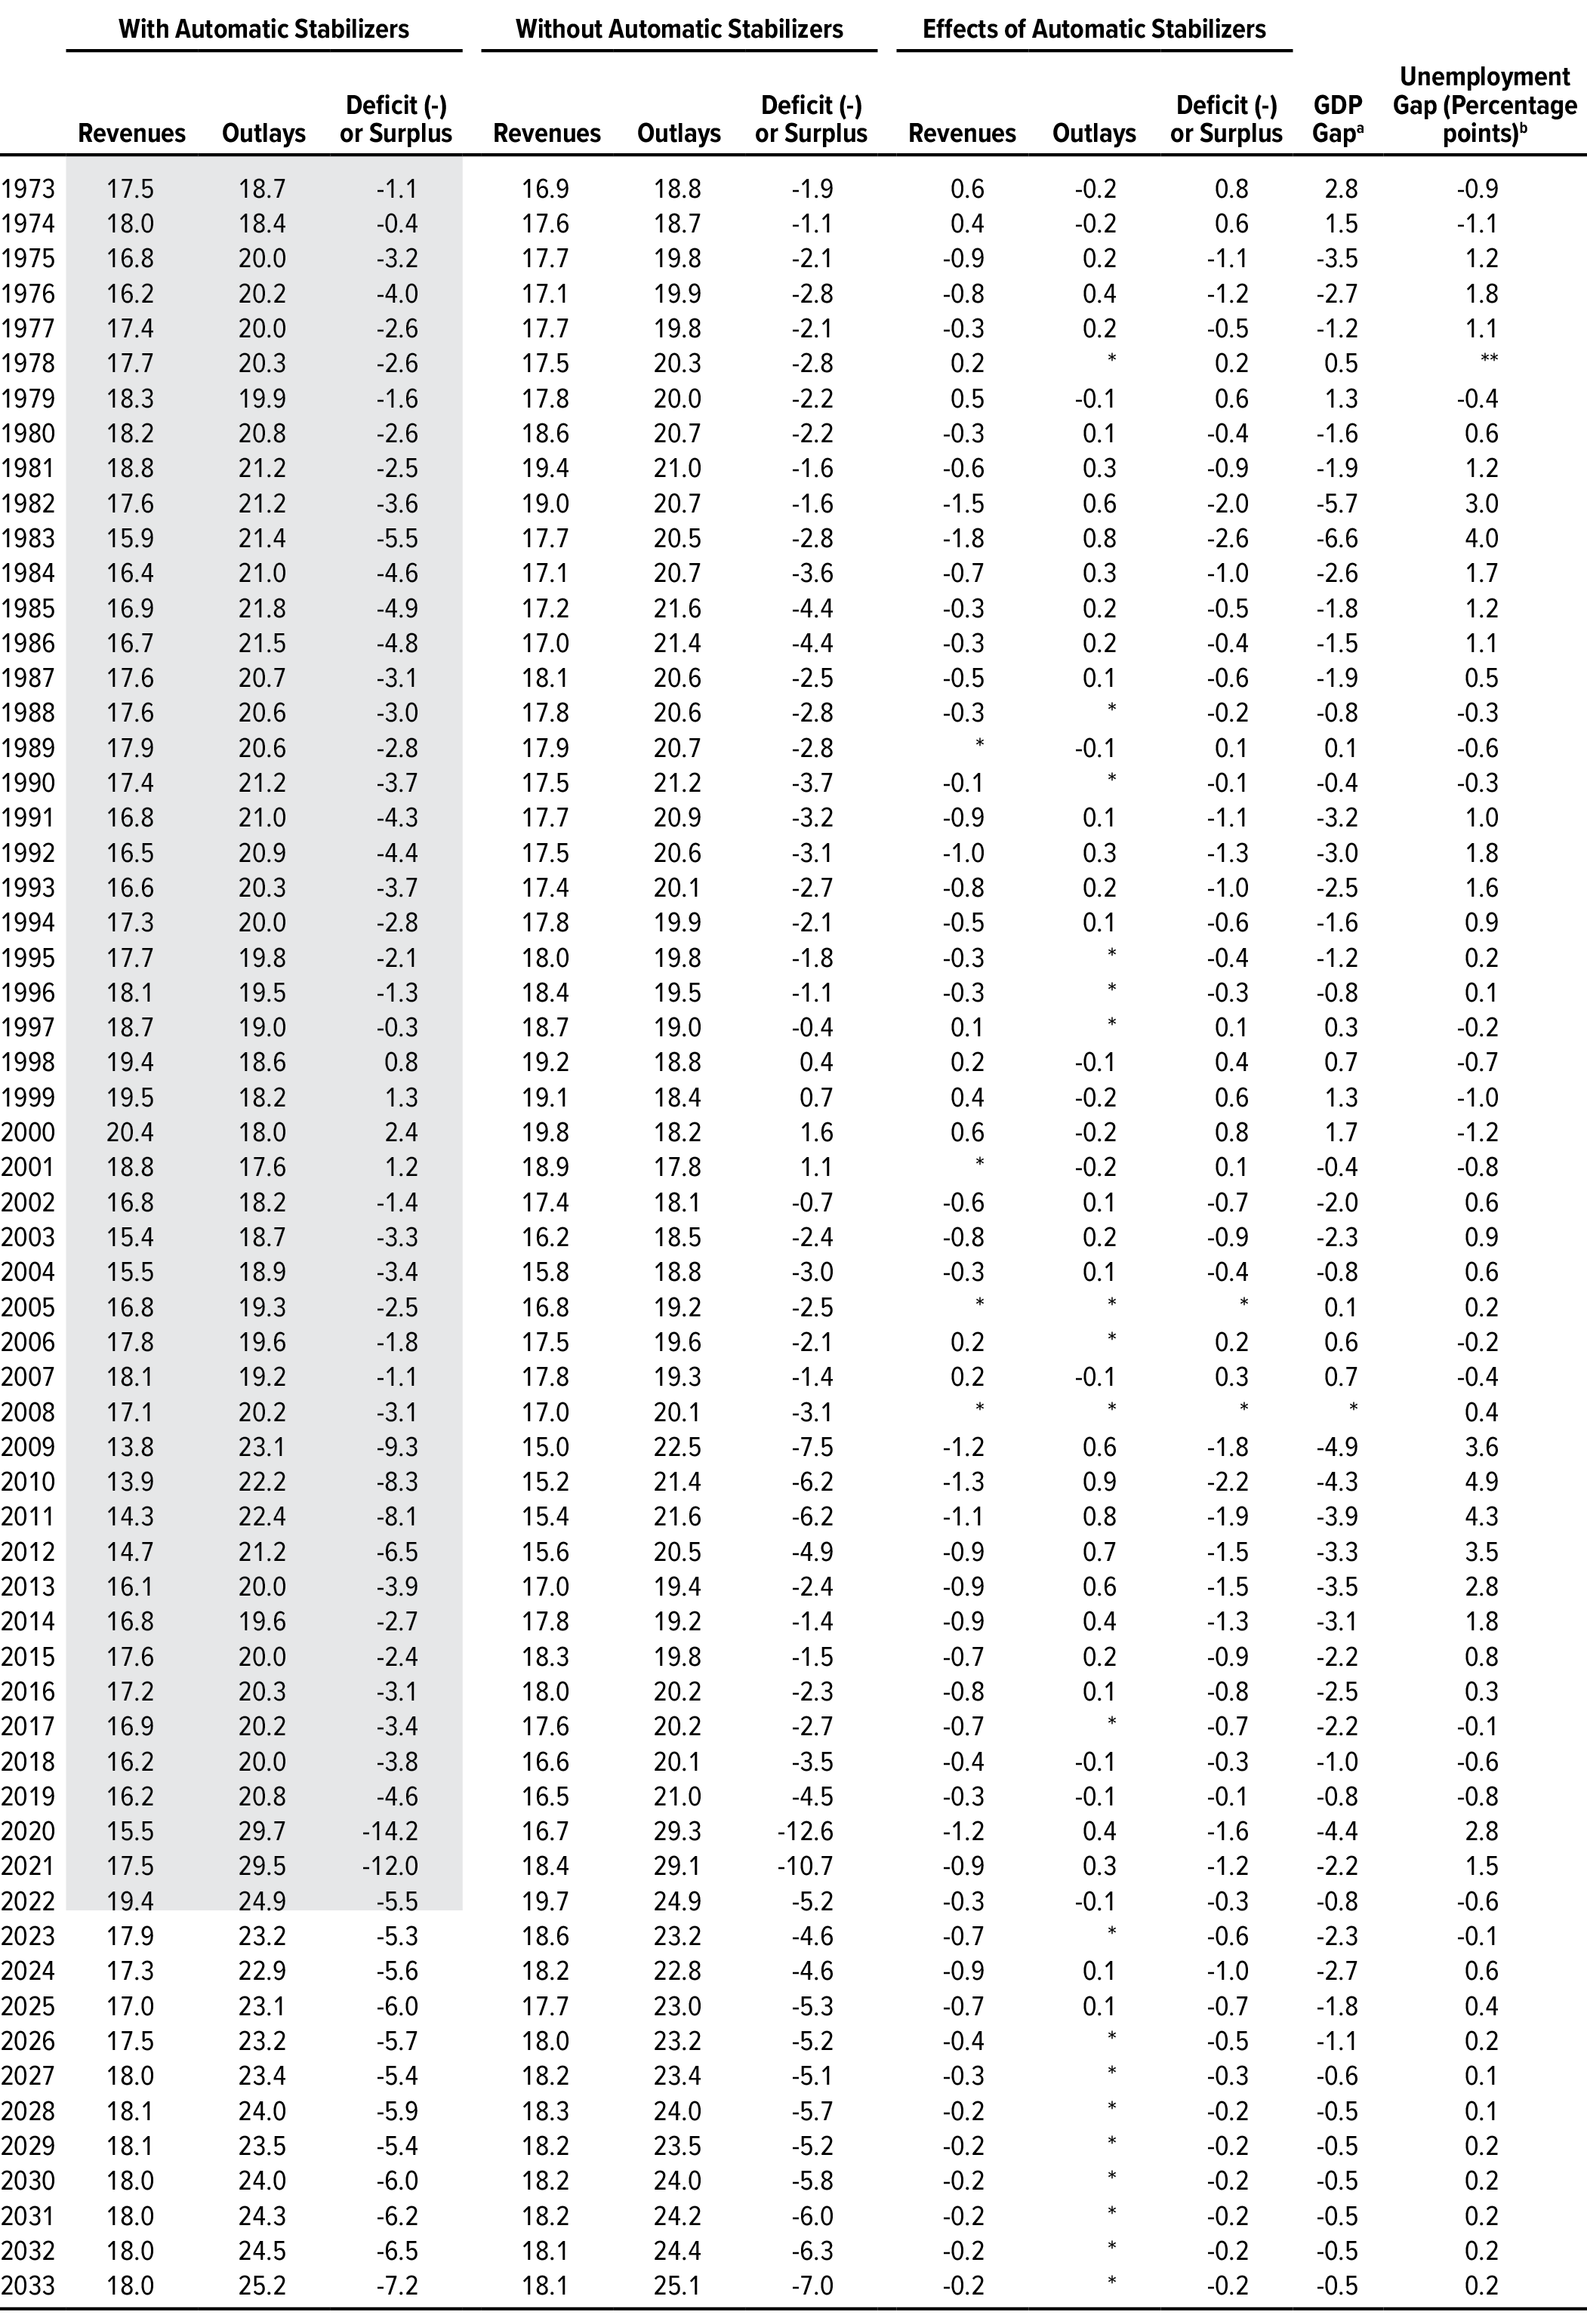
Data sources: Congressional Budget Office; Office of Management and Budget. See www.cbo.gov/publication/59114#data.
Automatic stabilizers are budget mechanisms that automatically help stabilize the economy by changing revenues and outlays in response to cyclical movements in GDP and unemployment.
Shaded values are actual amounts.
Projected deficits with automatic stabilizers are CBO’s current baseline projections of the federal budget deficit as presented in Congressional Budget Office, The Budget and Economic Outlook: 2023 to 2033 (February 2023), www.cbo.gov/publication/58848.
GDP = gross domestic product; * = between -0.05 percent and 0.05 percent; ** = between -0.05 percentage points and 0.05 percentage points.
a. The GDP gap equals the difference between actual or projected GDP and CBO’s estimate of potential GDP (the maximum sustainable output of the economy).
b. The unemployment gap equals the actual or projected rate of unemployment minus CBO’s estimate of the noncyclical rate of unemployment.
Figure 1.
Effect of Automatic Stabilizers on the Budget Deficit or Surplus
Percentage of Potential Gross Domestic Product
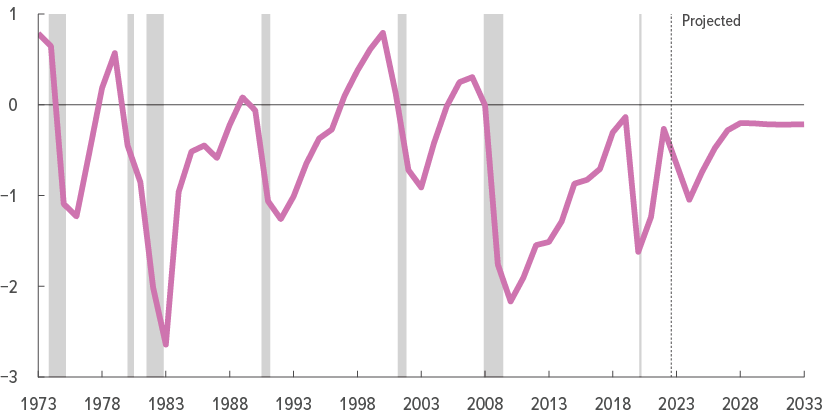
Data source: Congressional Budget Office. See www.cbo.gov/publication/59114#data.
Automatic stabilizers are budget mechanisms that automatically help stabilize the economy by changing revenues and outlays in response to cyclical movements in gross domestic product and unemployment.
A negative value indicates that automatic stabilizers increase the deficit, and a positive value indicates that they reduce the deficit (or increase the surplus).
Potential gross domestic product is CBO’s estimate of the maximum sustainable output of the economy.
Shaded vertical bars indicate the duration of recessions. (A recession extends from the peak of a business cycle to its trough.)
Data are fiscal year values.
Budget Deficits Without Automatic Stabilizers
Removing CBO’s estimate of the effect of automatic stabilizers from the federal budget deficit yields an estimate of what the deficit would be if GDP was at its potential, the unemployment rate equaled its noncyclical rate, and all other factors were unchanged. The budget deficit without automatic stabilizers—also referred to as the cyclically adjusted deficit—can help analysts evaluate the extent to which actual and projected changes in the deficit are caused by factors other than cyclical developments in the economy, such as past or scheduled changes in policy and long-run demographic trends.
If current laws generally remained unchanged, the deficit without automatic stabilizers would average 5.5 percent of potential GDP from 2023 to 2033, CBO projects—markedly greater than the 2.9 percent of potential GDP it averaged in the 50 years from 1973 to 2022. In CBO’s projections, budget deficits without automatic stabilizers increase from 4.6 percent of potential GDP in 2023 to 7.0 percent of potential GDP in 2033—larger than in any year before the coronavirus pandemic except for 2009. Measured as a percentage of potential GDP, the budget deficit without automatic stabilizers in 2033 would be 0.2 percentage points smaller than the deficit in CBO’s baseline (which includes the effects of automatic stabilizers). The increase over the 2023–2033 period would not be continuous, however. In 2026 and 2027, the deficit without automatic stabilizers would be smaller than it would be in 2025, largely because of an uptick in revenue growth attributable to the expiration of certain provisions of the 2017 tax act (Public Law 115-97) at the end of calendar year 2025 (see Figure 2).
Figure 2.
Budget Deficit or Surplus With and Without Automatic Stabilizers
Percentage of Potential Gross Domestic Product
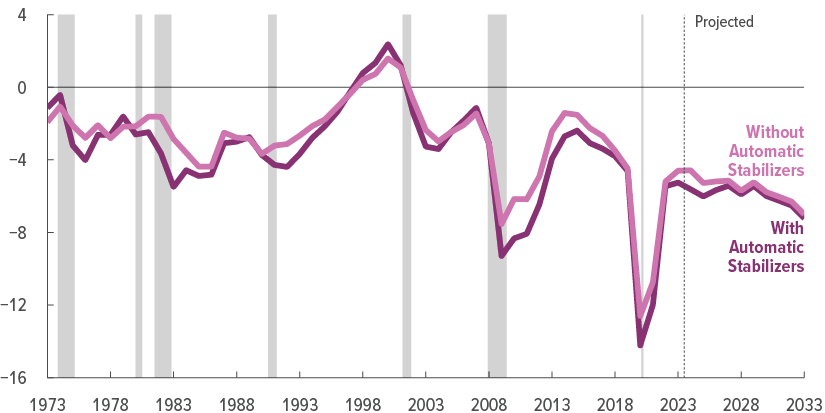
Data sources: Congressional Budget Office; Office of Management and Budget. See www.cbo.gov/publication/59114#data.
Automatic stabilizers are budget mechanisms that automatically help stabilize the economy by changing revenues and outlays in response to cyclical movements in gross domestic product and unemployment.
A negative value indicates a deficit, and a positive value indicates a surplus.
Projected deficits with automatic stabilizers are CBO’s current baseline projections of the federal budget deficit as presented in Congressional Budget Office, The Budget and Economic Outlook: 2023 to 2033 (February 2023), www.cbo.gov/publication/58848.
Potential gross domestic product is CBO’s estimate of the maximum sustainable output of the economy.
Shaded vertical bars indicate the duration of recessions. (A recession extends from the peak of a business cycle to its trough.)
Data are fiscal year values.
Some of the year-to-year variation of the budget deficit without automatic stabilizers in the projection period can be attributed to timing shifts. When October 1 (the first day of the fiscal year) falls on a weekend, certain payments that would ordinarily have been made on that day are instead made at the end of September and thus are shifted into the previous fiscal year.6 If not for those shifts, the cyclically adjusted deficit would vary less over the next decade and would increase steadily after 2027.
Despite the exclusion of the estimated effects of cyclical movements in output and unemployment, the deficit without automatic stabilizers measured as a percentage of potential GDP is correlated with the business cycle. In particular, the deficit without automatic stabilizers has tended to increase during recessions and in the early phases of recovery periods. One reason for that correlation is that during times of recession or high unemployment, policymakers have often passed legislation to support a weak economy—such as cutting taxes or increasing government spending—that increased the deficit, as they did in 2020 and 2021. Because such changes require legislation and are not automatically built into existing law, their budgetary effects are not attributable to automatic stabilizers. After times of recession or high unemployment, the cyclically adjusted deficit has typically shrunk. That pattern was evident from 2009 to 2014, although the deficit without automatic stabilizers began to increase again in 2015 and is projected to increase over the 2023–2033 period.
Another reason that the deficit without automatic stabilizers is correlated with the business cycle may be that CBO’s methods for estimating the effects of automatic stabilizers only partially remove the budgetary effects of certain changes. For example, large fluctuations in the stock market, which have a notable effect on federal revenues from capital gains taxes, have not had a sufficiently regular relationship with business cycles to be considered primarily cyclical in nature.
1. Data going back to 1965 are available at www.cbo.gov/data/budget-economic-data#8, as are the agency’s previous estimates of the effects of automatic stabilizers.
2. This analysis was completed before the agency’s May 2023 budget projections were available. For the agency’s February 2023 economic forecast and budget projections, see Congressional Budget Office, The Budget and Economic Outlook: 2023 to 2033 (February 2023), www.cbo.gov/publication/58848.
3. CBO’s estimates of the effects of automatic stabilizers reflect the assumption that discretionary spending and interest payments do not respond automatically to the business cycle. For a description of the methods that CBO uses to estimate the effects of automatic stabilizers, see Frank Russek and Kim Kowalewski, How CBO Estimates Automatic Stabilizers, Working Paper 2015-07 (Congressional Budget Office, November 2015), www.cbo.gov/publication/51005.
4. In addition to showing the effects of automatic stabilizers in billions of dollars, CBO presents them as a percentage of potential GDP, which, unlike GDP, excludes fluctuations that are attributable to the business cycle.
5. For further discussion of CBO’s estimate of the average output gap, see Congressional Budget Office, Why CBO Projects That Actual Output Will Be Below Potential Output on Average (February 2015), www.cbo.gov/publication/49890. CBO’s estimate of the average unemployment gap is consistent with its estimate of the average output gap.
6. October 1 will fall on a weekend in 2023, 2028, and 2033, so certain payments will be shifted from fiscal years 2024, 2029, and 2034 to fiscal years 2023, 2028, and 2033.
This report supplements The Budget and Economic Outlook: 2023 to 2033, which is available at www.cbo.gov/publication/58848. In keeping with the Congressional Budget Office’s mandate to provide objective, impartial analysis, the report makes no recommendations.
Matthew Wilson prepared the report with guidance from Richard DeKaser, Devrim Demirel, and Jaeger Nelson.
Mark Doms and Jeffrey Kling reviewed the report. Rebecca Lanning edited it, and R. L. Rebach created the graphics and prepared the text for publication. The report is available at www.cbo.gov/publication/59114.
CBO seeks feedback to make its work as useful as possible. Please send comments to communications@cbo.gov.
Phillip L. Swagel
Director