
Notes
Unless this report indicates otherwise, all years referred to are federal fiscal years, which run from October 1 to September 30 and are designated by the calendar year in which they end. Numbers in the text, tables, and figures may not add up to totals because of rounding. The Congressional Budget Office has corrected this report since its original publication. The correction is described at the end of the report.
After each fiscal year ends, the Congressional Budget Office reviews its projections of federal revenues and outlays and the government’s budget deficit and compares them with actual budgetary outcomes for that year.1 By assessing the quality of its projections and identifying the factors that might have led to under- or overestimates of particular categories of federal revenues and outlays, CBO seeks to improve the accuracy of its work.
To review its projections for fiscal year 2023, CBO focused on its May 2022 budget projections and updated them to include the estimated effects of subsequently enacted legislation as reported in cost estimates prepared by CBO and the staff of the Joint Committee on Taxation (JCT), typically when the legislation was enacted.2 Those adjustments increased CBO’s projections of revenues by $26 billion (or 0.5 percent) and increased its projections of outlays by $40 billion (or 0.7 percent).3
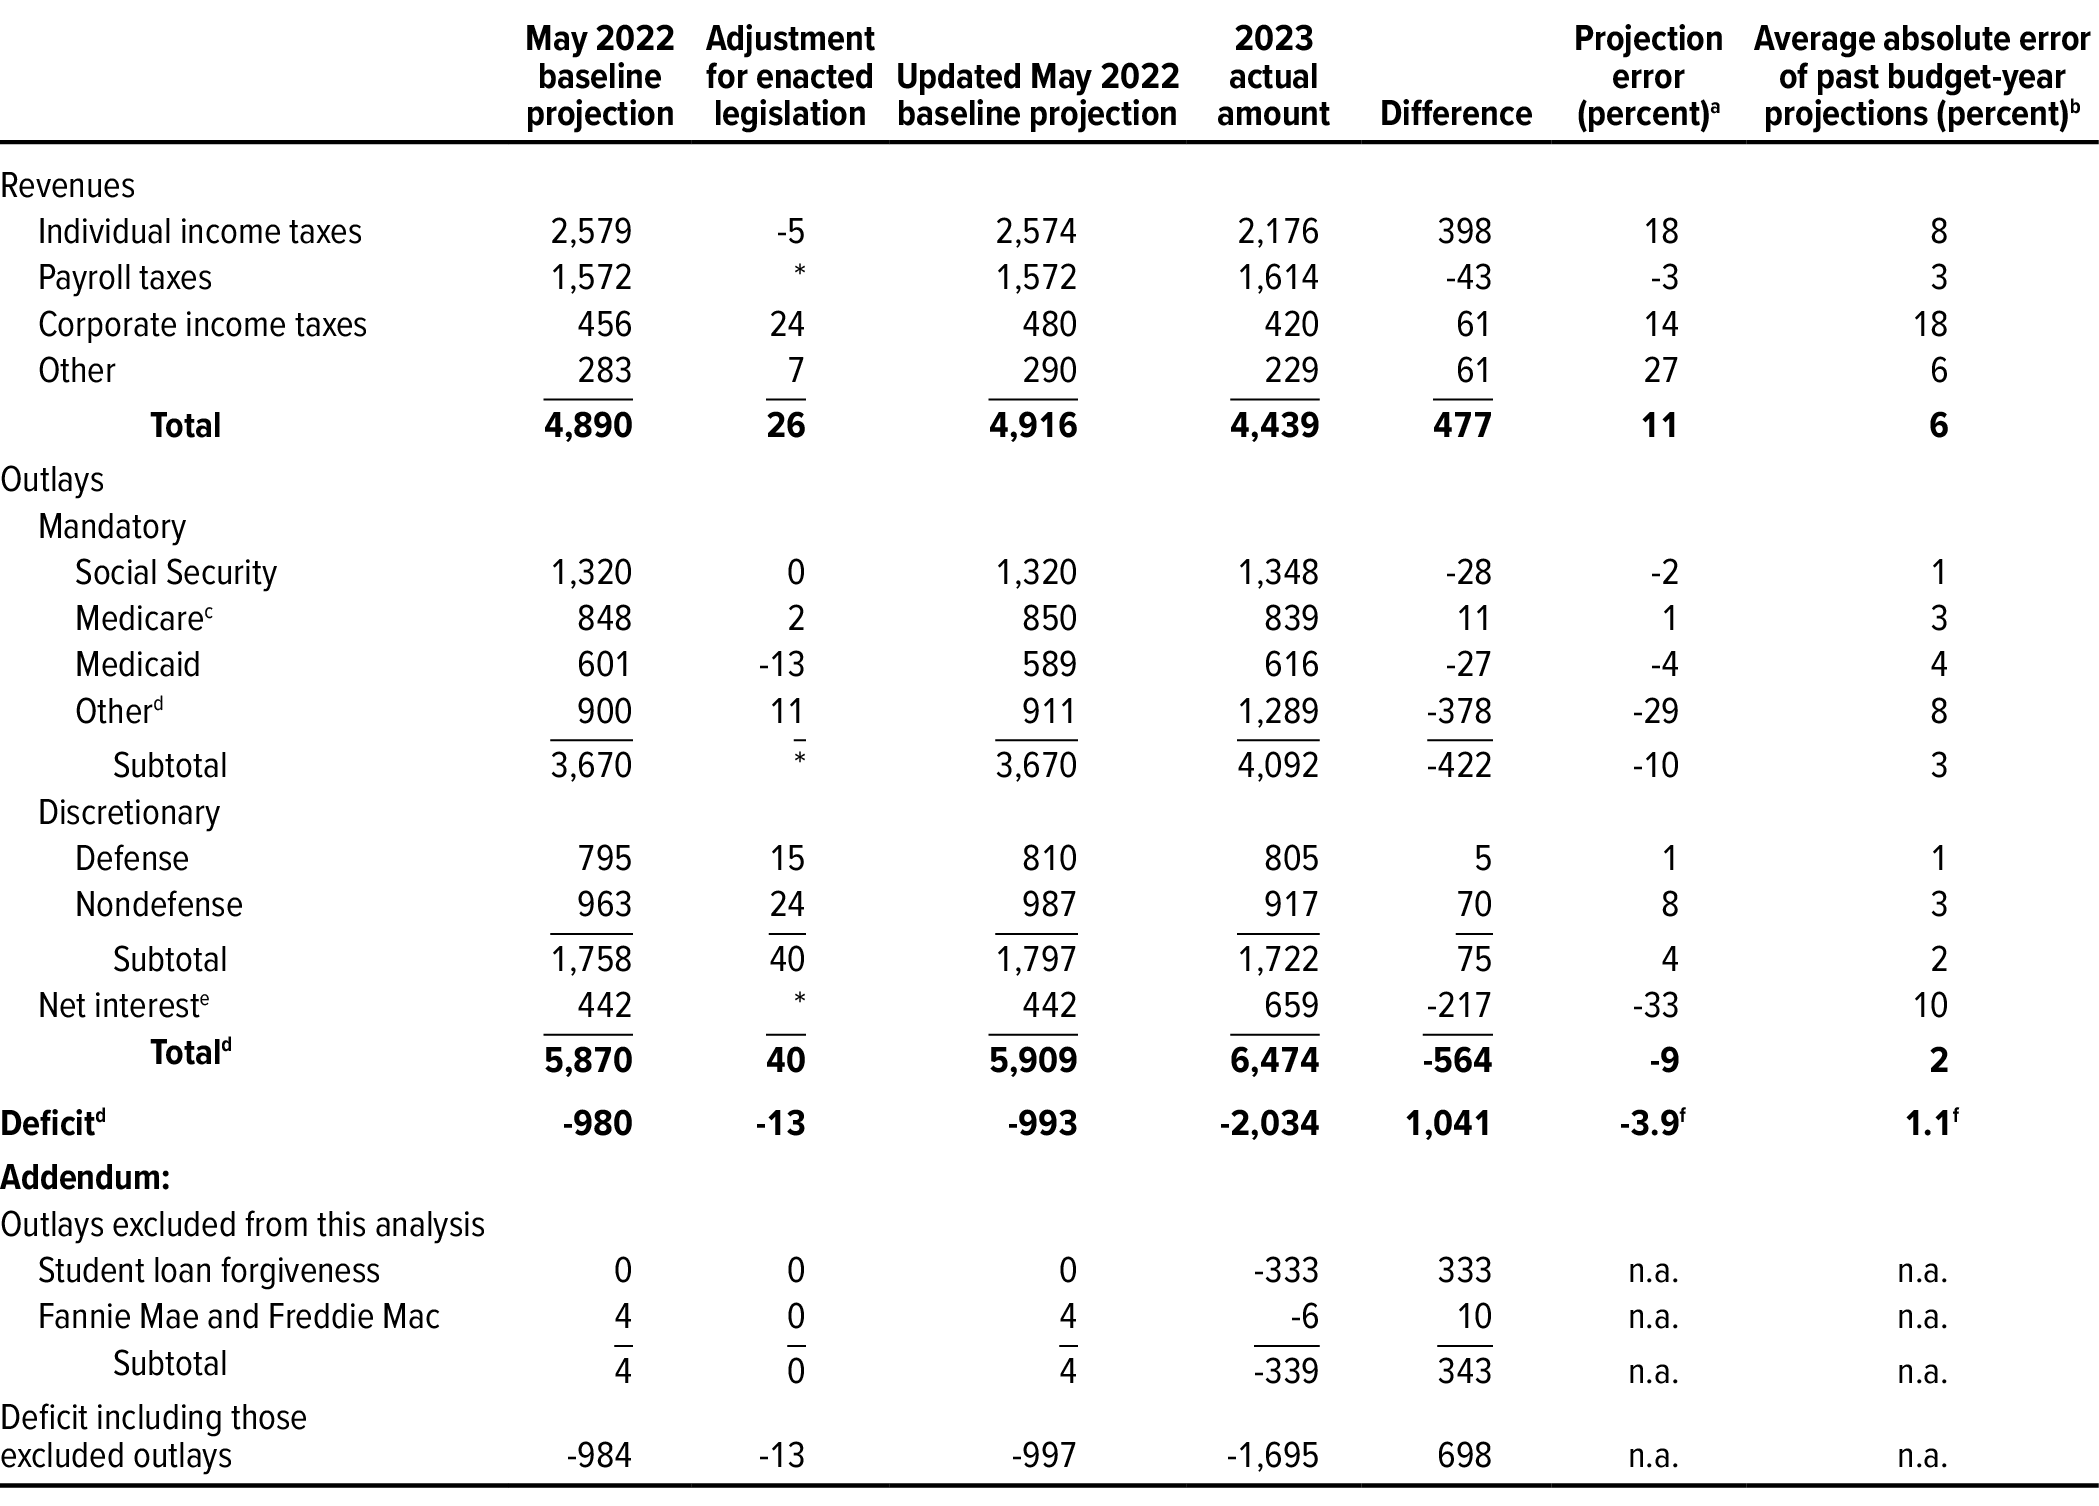
In addition to incorporating the effects of subsequently enacted legislation, CBO made two further adjustments. Because of their unusual size and nature, the estimated budgetary effects of the Supreme Court’s June 2023 decision prohibiting the Administration’s planned cancellation of outstanding student loans for many borrowers were excluded from this analysis (see Box 1). CBO also removed outlays for Fannie Mae and Freddie Mac from its projections and from estimates of actual outcomes because it accounts for the transactions of those entities differently from how the Administration accounts for them.4 After those adjustments, the overall differences between CBO’s budgetary projections and actual outcomes were as follows (see Table 1):
- Revenues. CBO’s projection of $4.9 trillion for federal revenues in 2023 was too high—by $0.5 trillion, or 11 percent. That difference was roughly twice the average absolute error of about 6 percent in CBO’s revenue projections for 1983 to 2022.5
- Outlays. CBO’s projection of $5.9 trillion for federal outlays in 2023 was too low—by $0.6 trillion, or 9 percent. That difference was more than four times the average absolute error of 2 percent in outlay projections for 1993 to 2022.
- Deficit. Because of the differences between projected and actual revenues and outlays, CBO’s deficit projection of $1.0 trillion for 2023 was $1.0 trillion less than the actual amount.6 That difference was equal to 3.9 percent of gross domestic product (GDP)—more than three-and-a-half times the average absolute error of 1.1 percent of GDP in the agency’s deficit projections for 1985 to 2022.
Table 1.
CBO’s Baseline Budget Projections for 2023, Compared With Actual Outcomes
Billions of dollars
Data sources: Congressional Budget Office; Department of the Treasury. See www.cbo.gov/publication/59682#data.
The budget projections presented here are based on projections published in Congressional Budget Office, The Budget and Economic Outlook: 2022 to 2032 (May 2022), www.cbo.gov/publication/57950. For this analysis, CBO updated those projections to account for the budgetary effects of subsequent legislation as estimated at the time of its enactment. For discretionary spending, the amounts reflect estimated outlays stemming from full-year appropriations provided for 2023. The projections are generally consistent with the technical assessments (of, for example, how quickly appropriations will be spent) and economic projections underlying the May 2022 baseline projections. In addition, the projected discretionary spending amounts include outlays estimated for 2023 from supplemental appropriations made in 2022 and 2023. Many of those estimates incorporated updated technical assessments.
n.a. = not applicable; * = between -$500 million and $500 million.
a. For outlay and revenue projections, the projection error is the projected amount minus the actual amount, divided by the actual amount. For deficit projections, the projection error is the difference between the projected and actual amounts expressed as a percentage of gross domestic product (GDP). CBO calculates errors for deficit projections that way because if they were expressed as a percentage of the dollar value of the actual amount, relatively small differences between projected and actual amounts in years with small deficits or surpluses would result in large projection errors.
b. The average absolute error is an average of projection errors without regard to whether they are positive or negative. The budget year is the second year of the period covered by CBO’s baseline projections; it usually begins several months after a spring baseline is released. The average absolute errors for revenue projections are based on budget-year projections for 1983 to 2022, those for projections of defense and nondefense discretionary spending are based on budget-year projections for 1999 to 2022, those for projections of all other spending categories are based on budget-year projections for 1993 to 2022, and those for deficit projections are based on budget-year projections for 1985 to 2022. The data necessary to calculate the errors in projections for earlier years are not available.
c. Includes the effects of Medicare premiums and other offsetting receipts related to Medicare.
d. Excludes the effects on outlays of the Supreme Court’s June 2023 decision prohibiting the Administration from implementing its plan to forgive a portion of many borrowers’ outstanding student loan debt; also excludes outlays related to the activities of Fannie Mae and Freddie Mac. All those outlays are classified as mandatory.
e. Includes the estimated effects on debt service of enacted legislation.
f. Expressed as a percentage of GDP, as explained in note a.
Box 1.
The Budgetary Effects of the Administration’s Student Loan Forgiveness Plan
In August 2022, the Administration announced a plan to cancel up to $10,000 of outstanding student loan debt for borrowers with income below specified limits and an additional $10,000 for those who received at least one Pell grant. The Administration recorded the present-value costs of that plan, which it estimated as a $379 billion increase in outlays, in September 2022, thereby increasing the 2022 budget deficit by that amount.1
In June 2023, the Supreme Court barred the Administration from implementing its forgiveness plan. Thus, in August 2023, the Administration recorded a $333 billion reduction in outlays for the student loan program. That action reduced the 2023 deficit.
The outlay savings recorded by the Administration in August 2023 were less than the costs recorded in September 2022 primarily because of a new income-driven repayment (IDR) plan, finalized in June 2023, that increased the cost to the federal government of outstanding student loans.2 The Administration recorded its estimate of the costs of the new IDR plan, which increased the deficit, at the same time as it recorded the reduction in outlays stemming from the Supreme Court’s decision. Because of the unusual size and nature of the debt forgiveness, the Congressional Budget Office did not include those estimated budgetary effects in this analysis or in its analysis of the accuracy of its 2022 projections.3
1. Under the Federal Credit Reform Act of 1990, the present values of expected reductions of cash inflows to the Treasury are calculated by discounting those flows. A present value is a single number that expresses a flow of current and future income (or payments) in terms of an equivalent lump sum received (or paid) at a specific time. The present value depends on the rate of interest (the discount rate) that is used to translate future cash flows into current dollars.
2. In March 2023, the Congressional Budget Office provided an estimate for the proposed rule for the IDR plan. Six months later, it published an estimate for H.J. Res. 88, which would repeal the final rule for that plan. Congressional Budget Office, letter to the Honorable Virginia Foxx and the Honorable William Cassidy, M.D., providing an estimate of the costs of the proposed income-driven repayment plan for student loans (March 13, 2023), www.cbo.gov/publication/58983, and cost estimate for H.J. Res. 88, a joint resolution providing for Congressional disapproval under chapter 8 of title 5, United States Code, of the rule submitted by the Department of Education relating to “Improving Income Driven Repayment for the William D. Ford Federal Direct Loan Program and the Federal Family Education Loan (FFEL) Program” (September 18, 2023), www.cbo.gov/publication/59565.
3. Congressional Budget Office, The Accuracy of CBO’s Budget Projections for Fiscal Year 2022 (January 2023), www.cbo.gov/publication/58603.
The three categories of revenues and outlays with the largest misestimates accounted for nearly three-fourths of the difference between the projected and actual deficit. An overestimate of receipts from individual income taxes contributed the most to the deficit difference (accounting for 38 percent of that total), followed by underestimates of net interest outlays (21 percent) and spending for higher education (14 percent).
How CBO Conducted This Analysis
CBO regularly publishes baseline projections of federal revenues, outlays, and deficits for the current fiscal year and the ensuing decade. Those projections reflect the assumption that current laws governing taxes and spending will generally remain unchanged. This analysis focuses on CBO’s May 2022 baseline projections for 2023.7
Any comparison of CBO’s projections with actual outcomes is complicated by the effects of legislation enacted after the projections were completed. CBO does not attempt to predict future legislative changes or their effects on revenues and outlays when it prepares its baseline budget projections, yet those changes invariably cause budgetary outcomes to differ from CBO’s estimates.
To account for those changes, CBO updated its projections to incorporate the estimates of the budgetary effects of subsequent legislation that were reported in CBO and JCT’s cost estimates as well as the estimated increase in spending for interest on the federal debt that resulted from enacted legislation. (Those effects on interest are not included in CBO’s cost estimates.) Thus, any errors in the initial cost estimates are reflected in the projection errors discussed in this report.
Adjusting projections to reflect the cost estimates for enacted legislation that CBO provided to the Congress for budget enforcement purposes allows the agency to evaluate the quality of that information. The Congress generally uses adjusted baseline projections when enforcing budgetary rules throughout the year as legislation is enacted. As a result, this report examines the accuracy of not only CBO’s initial baseline projections but also the information about the budgetary effects of legislation, including appropriations for 2023, that CBO provided to the Congress from May 2022 through September 2023, the end of fiscal year 2023.
How CBO’s Projections for 2023 Compare With Actual Outcomes
In its updated May 2022 baseline projections, which include the estimated budgetary effects of subsequent legislation, CBO overestimated revenues and underestimated outlays in 2023. As a result of those errors, the agency underestimated the federal deficit.
Revenues
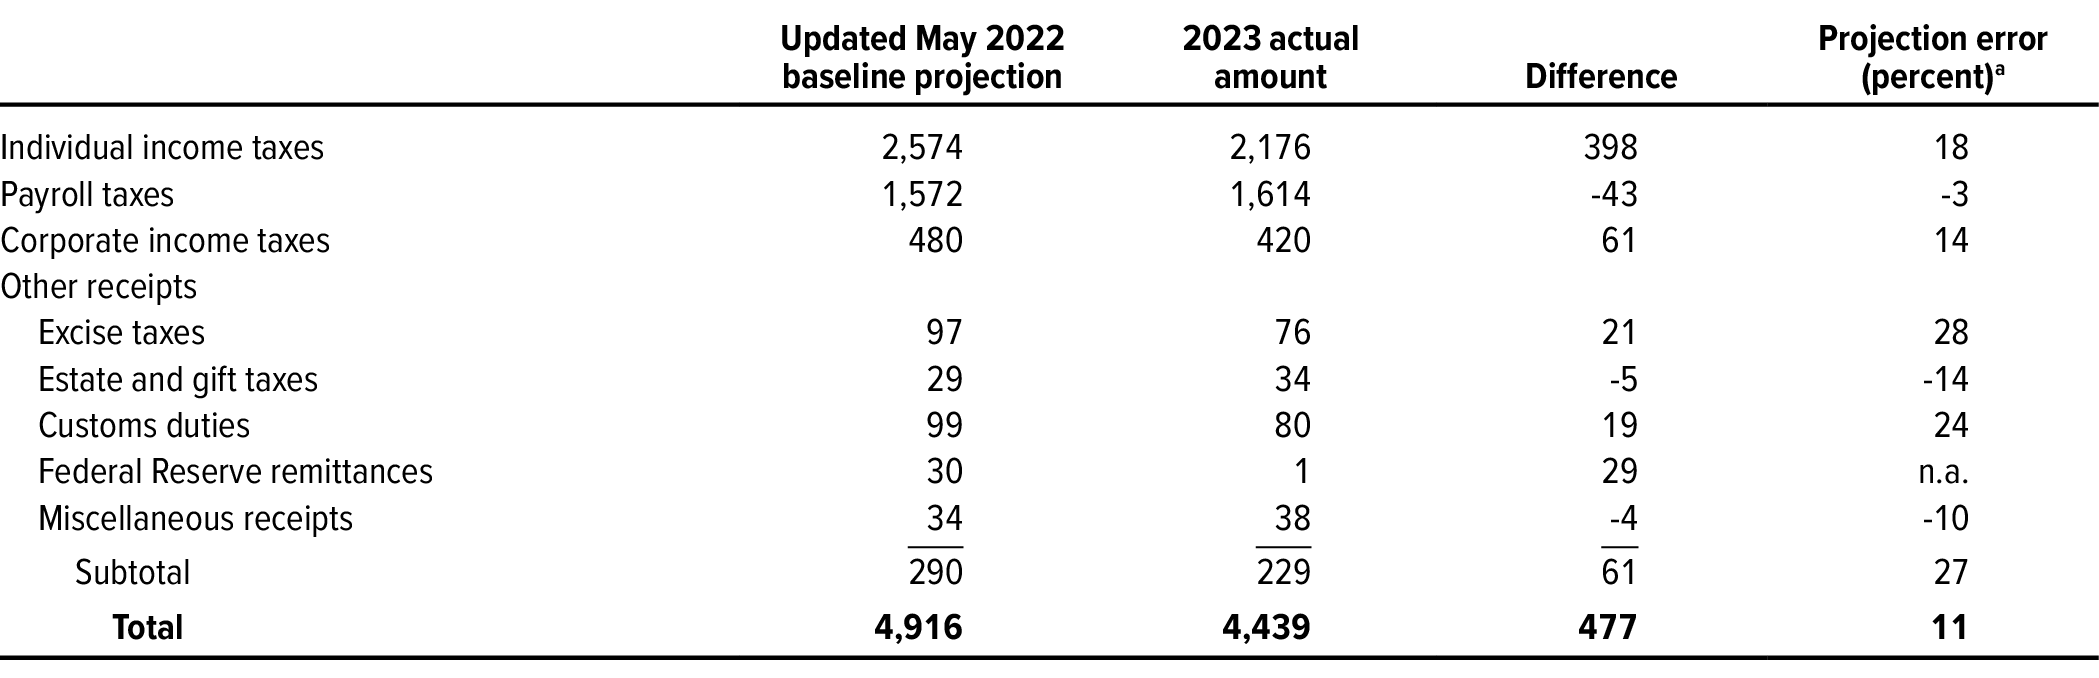
CBO’s projection of revenues for 2023 was $4.9 trillion, $0.5 trillion more than the actual amount (see Table 2). That 11 percent difference stemmed primarily from overestimates of receipts from individual income taxes. Overestimates of receipts from corporate income taxes and from other sources, such as excise taxes and customs duties, also contributed to the difference. Underestimates of estate and gift tax receipts partly offset the overestimates. CBO also underestimated receipts from payroll taxes; however, the amounts recorded by the Treasury for such receipts were based on estimates made near the beginning of the year and may be revised.
Table 2.
CBO’s Baseline Projections of Revenues for 2023, Compared With Actual Revenues
Billions of dollars
Data sources: Congressional Budget Office; Department of the Treasury. See www.cbo.gov/publication/59682#data.
The budget projections presented here are based on projections published in Congressional Budget Office, The Budget and Economic Outlook: 2022 to 2032 (May 2022), www.cbo.gov/publication/57950. For this analysis, CBO updated those projections to account for the budgetary effects of subsequent legislation as estimated at the time of its enactment.
n.a. = not applicable.
a. The projection error is the projected amount minus the actual amount, divided by the actual amount.
Projections of tax revenues are sensitive to underlying economic conditions and also to how policies are implemented and how taxpayers respond to them. Revenues typically rise or fall as economic activity increases or decreases, and rising prices tend to boost revenues. Moreover, when policies are implemented, the Treasury and the Internal Revenue Service (IRS) can take actions that result in payments’ being deferred beyond their normal or originally scheduled deadlines. For example, those agencies sometimes take more time than typical to issue regulations and guidance for new provisions, especially those that are particularly complex. Additionally, under some circumstances, the IRS is required to postpone certain deadlines, as it did in 2023 when it delayed tax payment deadlines for most taxpayers in California because much of the state was declared a federal disaster area. Revenues are also affected by how taxpayers respond to policy changes, which may differ from expectations. For example, the number of employers that claimed employee retention tax credits (ERTCs) in 2023 was greater than anticipated. The ERTCs were available to eligible employers as a credit against payroll taxes withheld in 2020 and 2021 (see Box 2).
Box 2.
The Budgetary Effects of Employee Retention Tax Credits
The Coronavirus Aid, Relief, and the Economic Security (CARES) Act established a tax credit for wages paid from March 13, 2020, through December 31, 2020, by employers that were subject to a governmental order restricting their business operations or experienced a significant decline in revenue during the coronavirus pandemic. The credit, known as the employee retention tax credit (ERTC), equaled a percentage (originally 50 percent, and later raised to 70 percent) of qualified wages plus the employer’s contributions for health insurance premiums, subject to specific limits. Employers could use that credit to reduce their share of payroll taxes.
Subsequent legislation—namely, the Consolidated Appropriations Act, 2021, and the American Rescue Plan Act of 2021—expanded the ERTC and extended it through December 30, 2021. Later, however, the Infrastructure Investment and Jobs Act limited the types of wages and employers that were eligible. When those laws were enacted, the staff of the Joint Committee on Taxation (JCT) estimated that the ERTC would have budgetary effects in fiscal years 2020 through 2022 but no effect in 2023. In the May 2022 baseline, the Congressional Budget Office also projected that the budgetary effects would end in 2022.
Employers can amend their tax returns up to three years after the filing deadline, and an unexpectedly large number have done so this year. CBO and JCT now estimate that through the end of 2023, about $50 billion in credits has been claimed on original returns and roughly $180 billion more has been claimed on amended returns; those estimates do not account for additional claims for ERTCs that have not yet been processed. Of the processed claims, CBO estimates that claims totaling more than $100 billion were paid to employers in 2023.
CBO currently estimates that ERTCs reduced income tax revenues by about $70 billion and increased outlays by $49 billion in 2023. Because of the way that the Treasury records income and payroll taxes, credits claimed on amended returns reduce receipts of income taxes from individual business owners and corporations. When the ERTC, which is refundable, exceeds a taxpayer’s liability, the government pays that excess to the employer, and the Treasury classifies the payment as an outlay for “U.S. Coronavirus Refundable Tax Credits.”
Differences between the actual implementation and use of new and existing tax policies and CBO’s judgments about how soon new tax policies would take full effect and how people would respond to them probably contributed to the overall error in the agency’s projections of revenues. Differences between actual economic conditions and CBO’s economic forecast may also have contributed to the error in the agency’s projections of some revenue sources, but such differences may have reduced errors in its projections of other sources. The specific factors contributing to the overestimates of revenues will be better understood as more detailed tax data become available over the next two years.
Individual Income Taxes. CBO’s projection of receipts from individual income taxes in 2023 was $2.6 trillion, $0.4 trillion (or 18 percent) more than the $2.2 trillion actually collected. CBO overestimated those receipts even though the current estimate by the Bureau of Economic Analysis (BEA) of income from sources subject to tax—including wages and salaries, distributions from pensions and retirement accounts, and income from rental property, interest, and dividends—for 2023 is 2 percent higher than CBO’s May 2022 projection of such income.
In CBO’s assessment, the following factors probably contributed the most to the overestimate:
- Collections of taxes on capital gains and other income correlated with asset values were smaller than anticipated. In May 2022, CBO projected that realizations of capital gains would rise by 6 percent in calendar year 2022, but the Standard & Poor’s 500 index fell by 4 percent during that year.8
- The IRS postponed deadlines for payments that would typically be due throughout the year until fiscal year 2024 for taxpayers affected by natural disasters, including most taxpayers in California, for whom the deadline for payment was extended to November 2023.9
- More employers than expected claimed the ERTC.
Another possible factor is that the distribution of earnings may have differed from CBO’s projections. A larger proportion of earnings than CBO projected may have accrued to workers below the top of the distribution. If so, earnings would have been taxed at a lower rate than the agency expected.
In addition to postponing tax-filing deadlines for certain taxpayers, the IRS has issued guidance allowing administrative transition periods or delaying the enforcement of newly enacted tax rules, which often enables people to temporarily postpone the realization of income or the payment of taxes. For example, for the past three years, the IRS has waived penalties associated with the failure to take a required minimum distribution from certain inherited retirement accounts while it works to finalize regulations. Similarly, in December 2022, the IRS announced a one-year delay in implementing stricter reporting requirements for third-party payment platforms, which were supposed to take effect in January 2023.10
Payroll Taxes. CBO’s projection of receipts from payroll taxes in 2023 was $1,572 billion, about $43 billion (or 3 percent) less than the actual amount of $1,614 billion. Most of that underestimate of payroll tax receipts results from the Treasury’s reallocation of income and payroll taxes. When the Treasury receives payments of withheld taxes, it cannot distinguish payroll taxes from individual income taxes. Instead, it first allocates withheld taxes to one category or the other on the basis of estimates made in advance of the actual collections. As additional information (including details from tax returns) becomes available, the Treasury periodically revises those allocations. In 2023, the Treasury reclassified $48 billion of past individual income tax receipts as payroll taxes, boosting the amount of payroll taxes recorded for the year.
Slower-than-expected growth in wages—the largest component of the tax base for payroll taxes—partly offset the effect of that reallocation. In September 2023, BEA published revised estimates of nominal wages and salaries, which indicated growth was about 1 percent slower than CBO anticipated in May 2022.
Corporate Income Taxes. CBO’s projection of receipts from corporate income taxes in 2023 was $480 billion, about $61 billion (or 14 percent) more than the $420 billion actually collected. The weakness in corporate income tax growth and the corresponding overestimate in CBO’s projection of receipts are surprising given that BEA’s estimates of nominal domestic corporate profits were 13 percent higher for calendar year 2022 and 8 percent higher for the first half of 2023 than CBO expected when it published its projections.
CBO’s overestimate may be partly attributable to administrative actions that granted deferrals in regular payments and established a longer timeline than CBO anticipated for enforcing new tax provisions. Specifically, for taxpayers affected by natural disasters, including most taxpayers in California, the IRS postponed the filing deadlines for payments usually due throughout the year. In October 2023, after the end of fiscal year 2023, receipts of corporate income taxes were $48 billion—triple the amount collected in the same month in the previous two years—suggesting that about $35 billion in payments may have been deferred.
Additionally, the 2022 reconciliation act created a new minimum tax on large corporations that took effect in 2023; that new tax required the IRS to draft guidance and regulations for corporations explaining how to calculate their liability for the tax. The IRS granted penalty relief for corporations during 2023 for payments related to the new tax until it finalized those necessary guidelines and regulations, effectively granting corporations a longer period to make initial payments.11 Finally, higher-than-anticipated claims for ERTCs may have reduced corporate income taxes (see Box 2).
Other Sources. CBO’s projection of receipts from all other sources in 2023 was about $290 billion, $61 billion (or 27 percent) more than the actual amount. Almost half of the difference between the projected and actual amounts is attributable to a $29 billion overestimate of remittances from the Federal Reserve to the Treasury. Short-term interest rates were higher than CBO anticipated, so the central bank’s interest expenses were greater—and, consequently, its remittances to the Treasury were smaller—than projected. Those remittances fell from $107 billion in 2022 to $1 billion in 2023.12
CBO overestimated customs duties by $19 billion (or 24 percent), in part because the actual value of imports was lower than the agency projected. Moreover, imports subject to higher administratively imposed tariffs—particularly imports from China—fell more rapidly than anticipated.
The agency’s projection of excise taxes for 2023 was $21 billion (or 28 percent) more than the actual amount collected. For taxpayers affected by natural disasters, including most taxpayers in California, the IRS postponed to fiscal year 2024 the filing deadlines for payments typically due throughout the year. In addition, refunds for excise taxes attributed to the nontaxable use of gasoline were much larger than anticipated and far exceeded amounts recorded in previous years. The overestimates of excise taxes were partly offset by a $5 billion (or 14 percent) underestimate of estate and gift taxes and by a $4 billion (or 10 percent) underestimate of other miscellaneous receipts.
Outlays
Updated to include the estimated effects of legislation enacted during the year, CBO’s baseline projection of outlays in 2023 was $5.9 trillion, $0.6 trillion (or 9 percent) less than the actual amount. In its baseline projections, CBO divides federal outlays into three broad categories—mandatory, discretionary, and net interest.13 CBO underestimated mandatory outlays and net outlays for interest, and it overestimated discretionary outlays.14
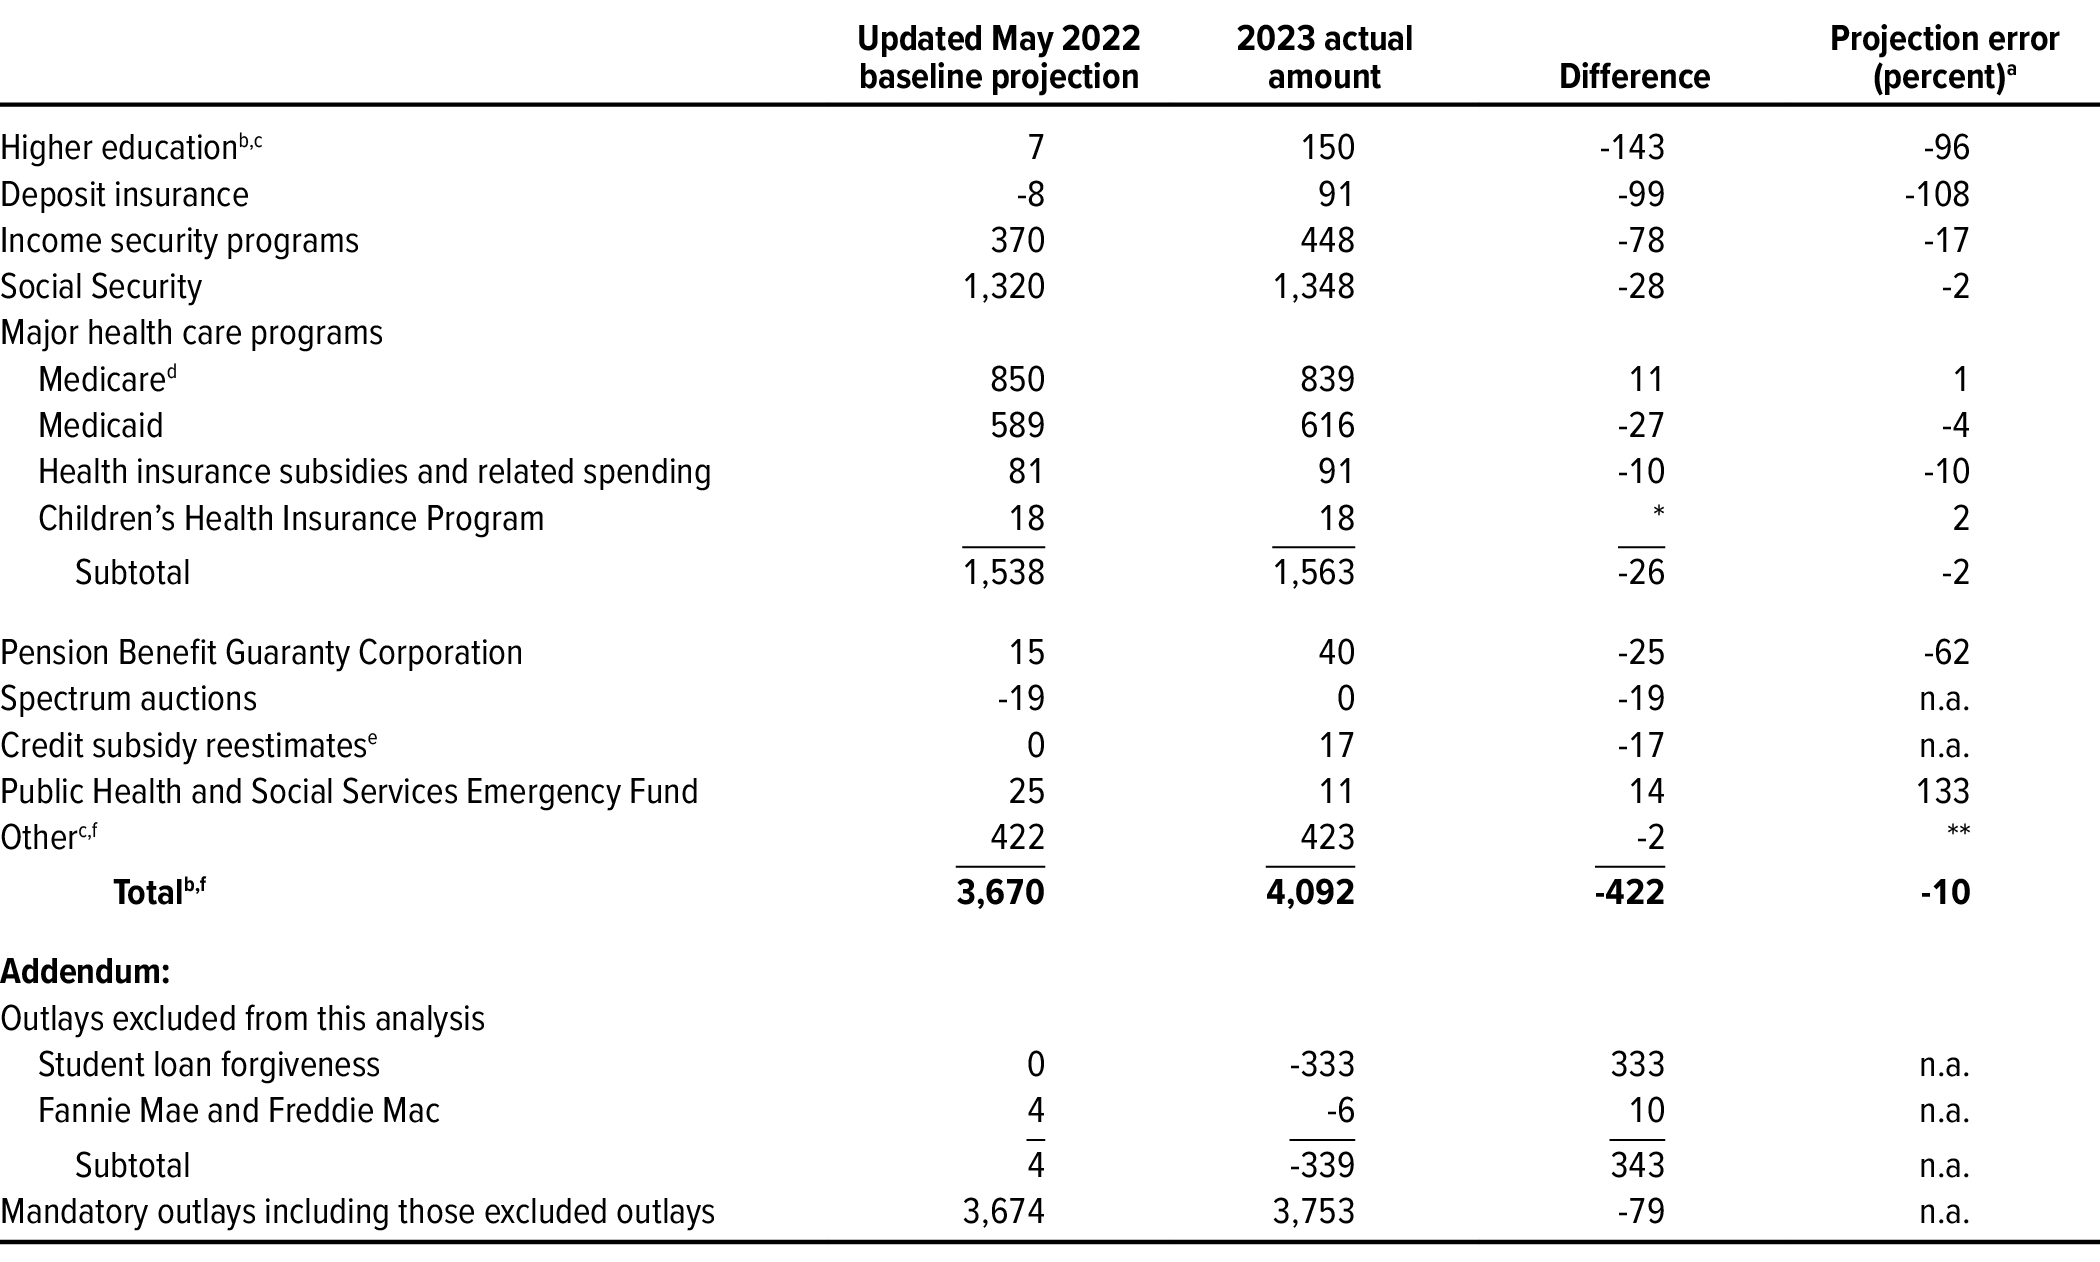
Mandatory Outlays. CBO’s projection of mandatory outlays in 2023 was $3.7 trillion, $0.4 trillion (or 10 percent) less than the actual amount of $4.1 trillion (see Table 3). Large underestimates of spending for higher education programs, deposit insurance, and income security programs account for three-quarters of that difference.
Table 3.
CBO’s Baseline Projections of Mandatory Outlays for 2023, Compared With Actual Outlays
Billions of dollars
Data sources: Congressional Budget Office; Department of the Treasury. See www.cbo.gov/publication/59682#data.
The budget projections presented here are based on projections published in Congressional Budget Office, The Budget and Economic Outlook: 2022 to 2032 (May 2022), www.cbo.gov/publication/57950. For this analysis, CBO updated those projections to account for the budgetary effects of subsequent legislation as estimated at the time of its enactment.
n.a. = not applicable; * = between zero and $500 million; ** = between -0.5 percent and zero.
a. The projection error is the projected amount minus the actual amount, divided by the actual amount.
b. Excludes the effects on outlays of the Supreme Court’s June 2023 decision prohibiting the Administration from implementing its plan to forgive a portion of many borrowers’ outstanding student loan debt.
c. Excludes the effects of updated estimates by federal agencies of the subsidy costs of certain federal loans and loan guarantees made in previous years. Those effects are reflected in the “Credit subsidy reestimates” line.
d. Includes the effects of Medicare premiums and other offsetting receipts related to Medicare.
e. A credit subsidy reestimate is a change in the estimated cost of an outstanding group of loans arising from changes in projections of those loans’ future cash flows. The Office of Management and Budget reestimates credit subsidy costs periodically to reflect changes in economic projections (of interest rates, for example) and in technical projections (of default rates, for example).
f. Excludes outlays related to the activities of Fannie Mae and Freddie Mac (which are classified as mandatory).
Higher Education. CBO’s projection of outlays for higher education in 2023 was $143 billion less than the actual amount. That difference was mostly the result of costs recorded by the Department of Education for modifications it made to the terms of outstanding student loans. The largest modifications were substantial changes to income-driven repayment plans and an extended pause in loan repayment and interest accrual. That $143 billion difference does not account for the Administration’s credit subsidy reestimates—changes in the estimated costs of outstanding federal student loans resulting from changes in economic and technical projections. (Those reestimates are included in the credit subsidy reestimates discussed below.) It also excludes the estimated budgetary effects of the Supreme Court’s June 2023 decision prohibiting the Administration from implementing its plan to forgive a portion of many borrowers’ outstanding student loan debt (see Box 1).
Deposit Insurance. CBO underestimated outlays for deposit insurance by $99 billion. That underestimate stems from payments made by the Federal Deposit Insurance Corporation (FDIC) to facilitate the resolution of bank failures in spring 2023. Four bank failures occurred during fiscal year 2023 (three in the spring and one later in the year). In its May 2022 baseline, CBO projected the budgetary effects of bank failures on the basis of historical experience, but the costs associated with resolving the bank failures in 2023 significantly exceeded those projections. (CBO expects the FDIC to recover those amounts over the next several years by liquidating assets and by collecting higher premiums from FDIC-insured institutions.)
Income Security. CBO underestimated outlays in 2023 for income security programs—which make payments to certain people and government entities to assist the poor, the unemployed, and others in need—by $78 billion (or 17 percent).
The largest differences between projected and actual amounts were in outlays associated with refundable tax credits and with the Supplemental Nutrition Assistance Program (SNAP). CBO’s estimate of the portion of refundable tax credits paid to individuals and businesses and recorded as outlays was too low, by $56 billion.15 Employee retention tax credits accounted for $49 billion of that amount (see Box 2). The agency underestimated outlays for SNAP by $18 billion, primarily because participation in the program was greater than anticipated.
Social Security. CBO’s projection of outlays for Social Security was $28 billion less than the amount recorded. Social Security provides annual cost-of-living adjustments (COLAs) based on changes in the consumer price index for urban wage earners and clerical workers (CPI-W). The primary reason for CBO’s underestimate was that inflation as measured by the CPI-W—and thus the actual COLA for 2023—was greater than the agency forecast.
Major Health Care Programs. CBO underestimated outlays for the major health care programs—spending for Medicare, Medicaid, and the Children’s Health Insurance Program (CHIP), as well as subsidies for health insurance purchased through the marketplaces established under the Affordable Care Act and related spending—by $26 billion (or 2 percent).
CBO’s projections for Medicare and CHIP were close to the actual amounts, exceeding actual outlays by $11 billion (or 1 percent) and by less than $1 billion (or 2 percent), respectively.
CBO underestimated Medicaid outlays in 2023 by $27 billion (or 4 percent). Outlays for the program were greater than expected even though enrollment in the program declined after the continuous eligibility policy put in place during the coronavirus pandemic ended on April 1, 2023. Whereas CBO projected that 6 million people would lose coverage from April to the end of September because of the winding down of that policy, 7.8 million people actually did so. Nevertheless, spending did not decline at the same rate as enrollment and remained higher than expected. The specific factors contributing to the underestimate will be better understood as more data become available.
CBO’s projection of outlays for subsidies for health insurance purchased through the marketplaces and related spending was $10 billion (or 10 percent) less than the actual amount in 2023. That underestimate mostly resulted from higher-than-expected enrollment in subsidized health insurance coverage.
Pension Benefit Guaranty Corporation. In its projection for 2023, CBO underestimated outlays for the Pension Benefit Guaranty Corporation (PBGC). Whereas it projected those outlays would total $15 billion, they actually amounted to $40 billion. That underestimate occurred primarily because outlays from the PBGC’s special financial assistance program for financially troubled multiemployer pension plans were made later than CBO anticipated. In May 2022, CBO projected that $41 billion (of an estimated $86 billion in total assistance) would be paid in 2022 and $20 billion would be paid in 2023. Instead, only $8 billion was paid in 2022, and $42 billion was paid in 2023.
Spectrum Auctions. CBO’s projection of receipts from the Federal Communications Commission’s auctions of licenses for commercial use of the electromagnetic spectrum (which are recorded in the budget as reductions in mandatory outlays) exceeded the actual amount collected in 2023 by $19 billion because of the timing of the collection of those receipts. On the basis of past auctions, CBO anticipated that receipts from most of the bids in an auction held in January 2022 would be recorded in fiscal year 2023. Instead, the Administration recorded the entire amount at the end of fiscal year 2022, resulting in an overestimate of receipts from the auctions (and thus an underestimate of mandatory outlays) of $19 billion in CBO’s projection for 2023.
Credit Subsidy Reestimates. Federal agencies regularly update their estimates of the subsidy costs of certain federal loans and loan guarantees made in previous years.16 Because CBO has no basis for determining what revisions to estimated subsidy costs, if any, will be made in the future, it does not include estimates of such revisions in its baseline projections. In 2023, reestimates of the subsidy costs of federal credit programs increased recorded outlays, on net, by $17 billion and resulted in actual outlays’ exceeding CBO’s projections by that amount. The Small Business Administration (SBA) recorded a $28 billion increase in the estimated costs of disaster relief loans. That increase was partially offset by a number of downward revisions, the two largest of which were a $5 billion reduction in the costs of mortgage guarantees made by the Department of Housing and Urban Development and a $4 billion reduction in the costs of business loans made by the SBA in previous years.
Other Mandatory Programs. CBO’s projections of outlays for all other mandatory programs exceeded actual amounts by $13 billion (or 3 percent). The largest difference was in outlays from the Public Health and Social Services Emergency Fund: CBO’s projection exceeded the actual amount by $14 billion (or 133 percent).
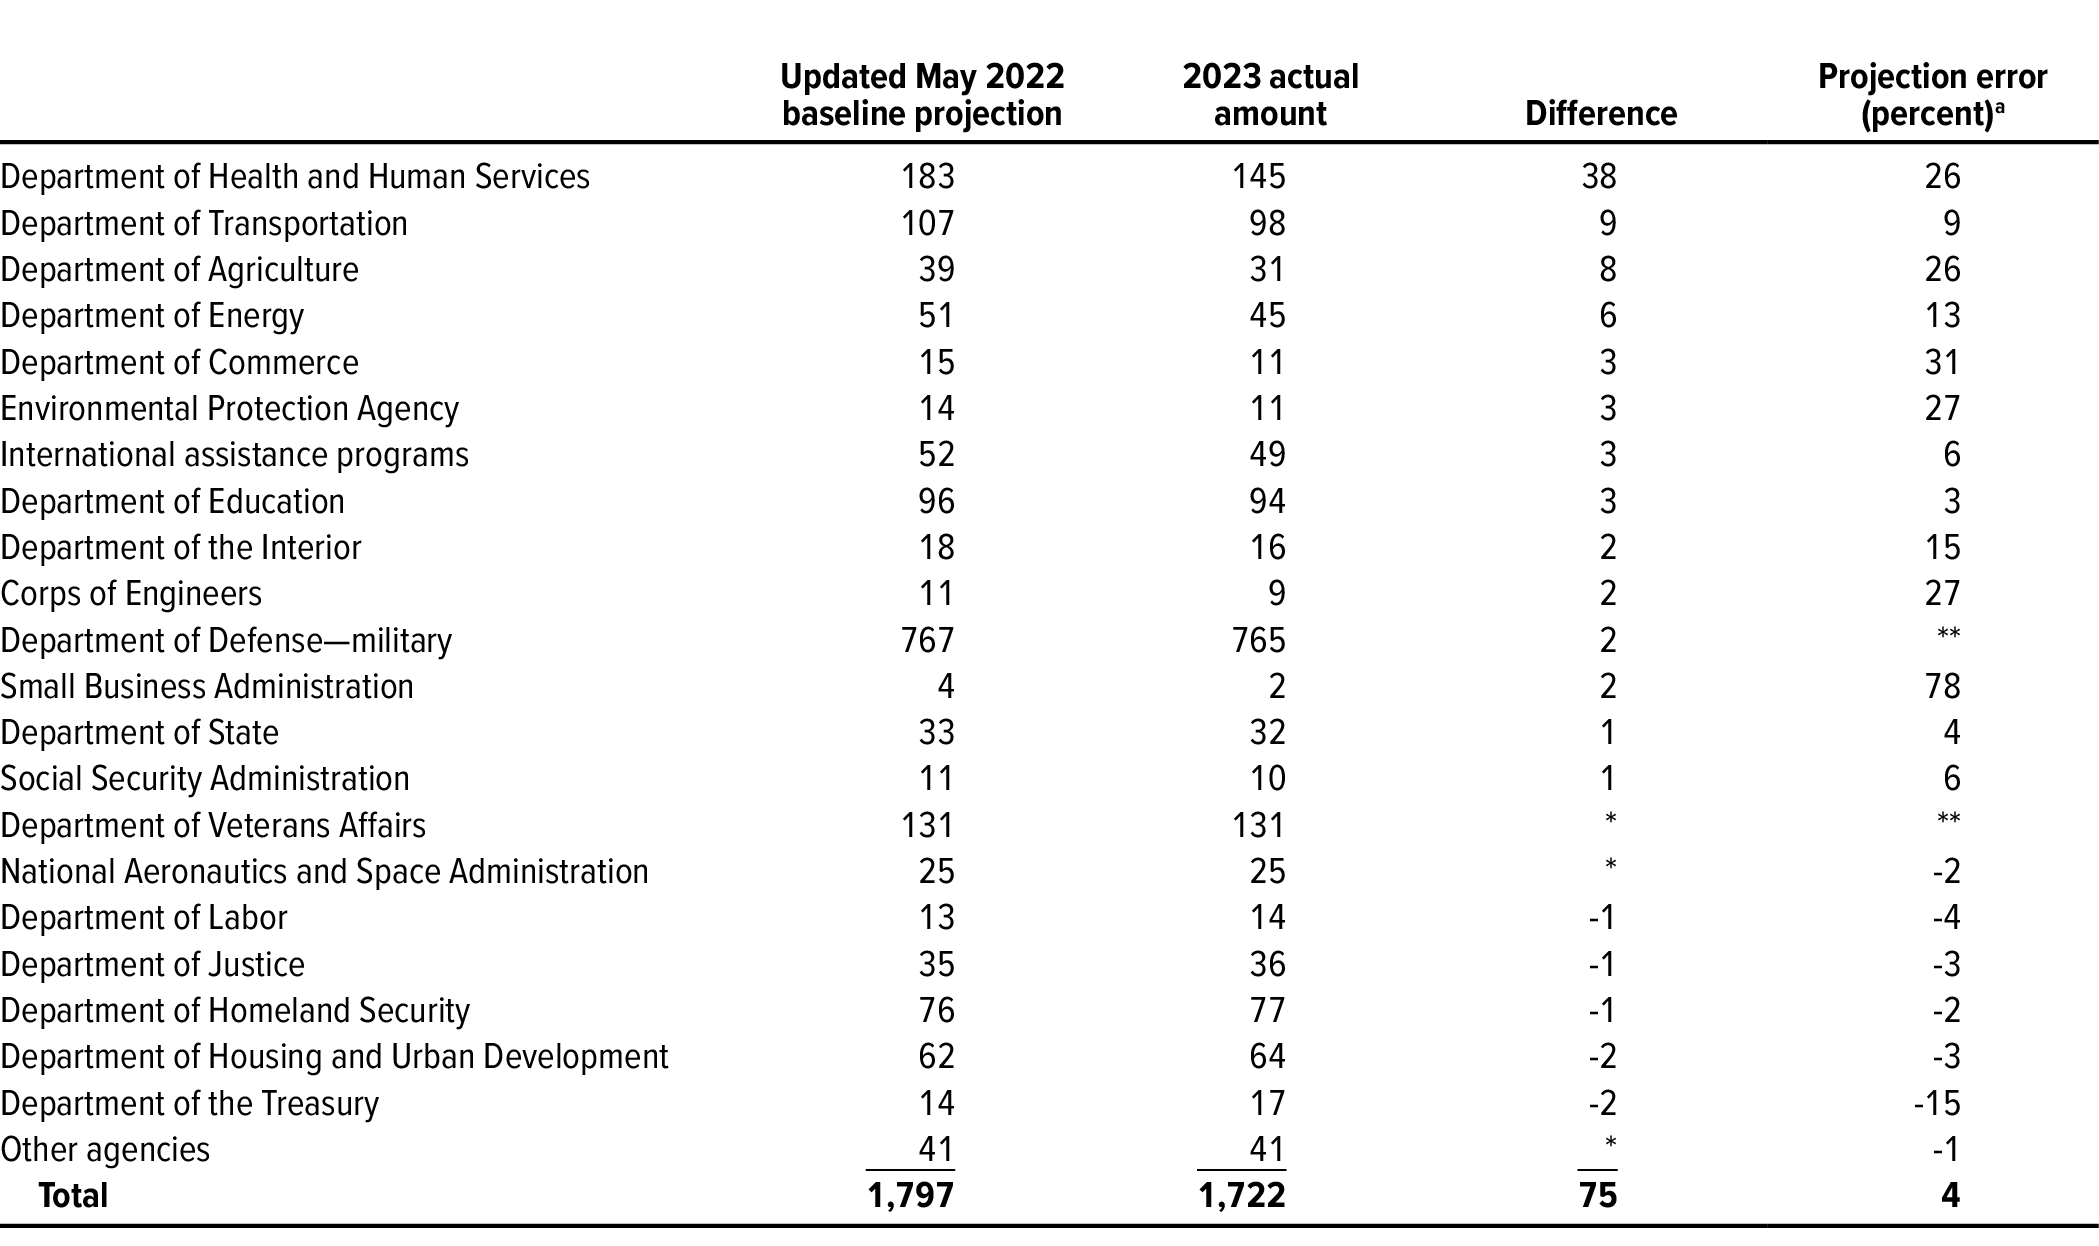
Discretionary Outlays. To evaluate its projections of discretionary outlays, CBO updated the funding amounts in its May 2022 baseline projections to reflect the regular full-year appropriations provided for 2023 in appropriation bills enacted in the first few months of the fiscal year. The updated projections generally reflect the same technical assessments and economic projections that underlay the agency’s May 2022 baseline projections. For supplemental appropriations, however, CBO applied technical assessments that reflected the agency’s views when the appropriations were enacted. With those adjustments, CBO’s projection of discretionary outlays in 2023 was $1.8 trillion, $75 billion (or 4 percent) more than the $1.7 trillion recorded in the budget. CBO overestimated defense outlays by $5 billion (or 1 percent) and nondefense outlays by $70 billion (or 8 percent).
CBO’s projections of discretionary outlays for many agencies were close to the actual amounts in 2023 (see Table 4). Projections for a few agencies, however, contained significantly larger errors. The largest differences between projected and actual amounts, all of which were overestimates, were as follows:
- CBO’s projection of spending by the Department of Health and Human Services was $38 billion (or 26 percent) more than the actual amount. Spending from the Public Health and Social Services Emergency Fund accounted for most of that overestimate. That fund received large appropriations in 2020 and 2021 for COVID-19 testing, contact tracing, the purchase and manufacture of vaccines and therapeutics, and payments to health care providers. CBO anticipated that the rate of spending from the fund in 2023 would be similar to the rate at the end of 2022. Instead, such spending—particularly payments to health care providers—slowed significantly in 2023. CBO also overestimated spending by the Centers for Disease Control and Prevention (by $3 billion) and payments for refugee and entrant assistance (by $3 billion).
- CBO overestimated spending by the Department of Transportation by $9 billion (or 9 percent). Lower-than-anticipated outlays for the Federal-Aid Highway program, the Federal Railroad Administration, and Amtrak accounted for most of that difference.
- CBO’s projection of spending by the Department of Agriculture exceeded the actual amount by $8 billion (or 26 percent), mainly because outlays for the Emergency Relief Program, which provides disaster assistance to agricultural producers, were less than anticipated.
Table 4.
CBO’s Baseline Projections of Discretionary Outlays for 2023, Compared With Actual Outlays
Billions of dollars
Data sources: Congressional Budget Office; Department of the Treasury. See www.cbo.gov/publication/59682#data.
The budget projections presented here are based on projections published in Congressional Budget Office, The Budget and Economic Outlook: 2022 to 2032 (May 2022), www.cbo.gov/publication/57950. For this analysis, CBO updated those projections to account for the budgetary effects of subsequent legislation as estimated at the time of its enactment. The amounts reflect estimated outlays stemming from full-year appropriations provided for 2023. Those projections are generally consistent with the technical assessments (of, for example, how quickly appropriations will be spent) and economic projections underlying the May 2022 baseline. In addition, the projected discretionary spending amounts include outlays estimated for 2023 from supplemental appropriations made in 2022 and 2023. Many of those estimates incorporated updated technical assessments.
* = between -$500 million and zero; ** = between -0.5 percent and 0.5 percent.
a. The projection error is the projected amount minus the actual amount, divided by the actual amount.
Net Interest. Net outlays for interest are the government’s interest payments on debt held by the public minus its income from interest. CBO’s projection of those outlays for 2023 was $442 billion, $217 billion (or 33 percent) less than the actual amount of $659 billion (see Table 1).
Most of the difference between projected and actual net interest outlays was attributable to economic factors. In particular, interest rates in 2023 were higher than CBO anticipated in March 2022, when it finalized the economic forecast underlying its May 2022 baseline budget projections. Whereas CBO projected that the interest rate on 3-month Treasury bills would average 1.8 percent in 2023 and that the interest rate on 10-year Treasury notes would average 2.8 percent, those rates actually averaged 4.8 percent and 3.8 percent, respectively.
How the Accuracy of CBO’s Projections for 2023 Compares With the Accuracy of Its Past Budget Projections
The errors in CBO’s projections of revenues and outlays in 2023 were larger than the average absolute errors in the agency’s projections for previous years. Because those errors—an overestimate of revenues and an underestimate of outlays—were not offsetting but instead worked together to push the agency’s projection of the deficit well below the actual amount, the error in the projected deficit for 2023 was substantially larger than the average absolute error in previous years.17
Deficit
In projections for the budget year that CBO made for 1985 through 2022, the agency overestimated the deficit roughly two-thirds of the time, and the average absolute error of those deficit projections equaled 1.1 percent of GDP. In its updated May 2022 baseline projections, CBO underestimated the deficit in 2023 by $1 trillion, or 3.9 percent of GDP.
Revenues
In its budget-year projections for 1983 to 2022, CBO overestimated total revenues about as often as it underestimated them, and the average absolute error of those revenue projections was 6 percent.18 Revenues in 2023 in CBO’s updated May 2022 baseline projections exceeded the actual amount recorded that year by 11 percent (see Figure 1).
Figure 1.
Errors in CBO’s Baseline Projections of Revenues
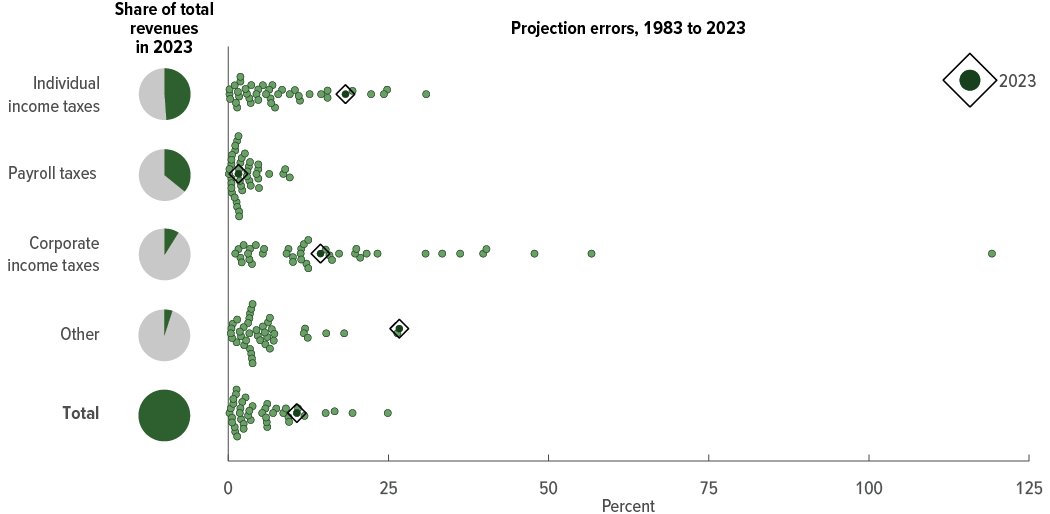
Data source: Congressional Budget Office. See www.cbo.gov/publication/59682#data.
The errors shown are for budget-year projections for 1983 to 2023. The budget year is the second year of the period covered by CBO’s baseline projections; it usually begins several months after a spring baseline is released.
CBO calculated projection errors by subtracting the actual amount from the projected amount and dividing that difference by the actual amount. The errors presented here are absolute errors; that is, they are shown as positive values regardless of whether they are positive or negative.
The projection errors for 2023 are based on projections published in Congressional Budget Office, The Budget and Economic Outlook: 2022 to 2032 (May 2022), www.cbo.gov/publication/57950. For this analysis, CBO adjusted those projections to include the estimated effects of subsequently enacted legislation.
CBO overestimated individual income tax revenues in 2023 by 18 percent—a larger error than most of the errors in projections of such receipts for 1983 to 2022. CBO’s projection of receipts from payroll taxes was 3 percent less than the actual amount collected, in line with most of the errors in the projections for the 1983–2022 period.
CBO’s projections of corporate income taxes have been particularly uncertain. The average absolute error in the agency’s projections of receipts from that source for 1983 to 2022 was 18 percent, the largest of the errors in the agency’s projections of the major sources of revenues. In its projection for 2023, CBO overestimated such receipts by 14 percent.
The agency’s projection of receipts from all other revenue sources exceeded the actual amount by 27 percent—an error larger than any of those in its projections of such receipts for 1983 to 2022.
Outlays
In its budget-year projections for 1993 to 2022, CBO overestimated total outlays 80 percent of the time; the average absolute error in those outlay projections was 2 percent.19 In CBO’s updated May 2022 baseline projections, the agency underestimated total outlays in 2023 by 9 percent—the largest error in a projection of total outlays that the agency has recorded (see Figure 2).
Figure 2.
Errors in CBO’s Baseline Projections of Outlays
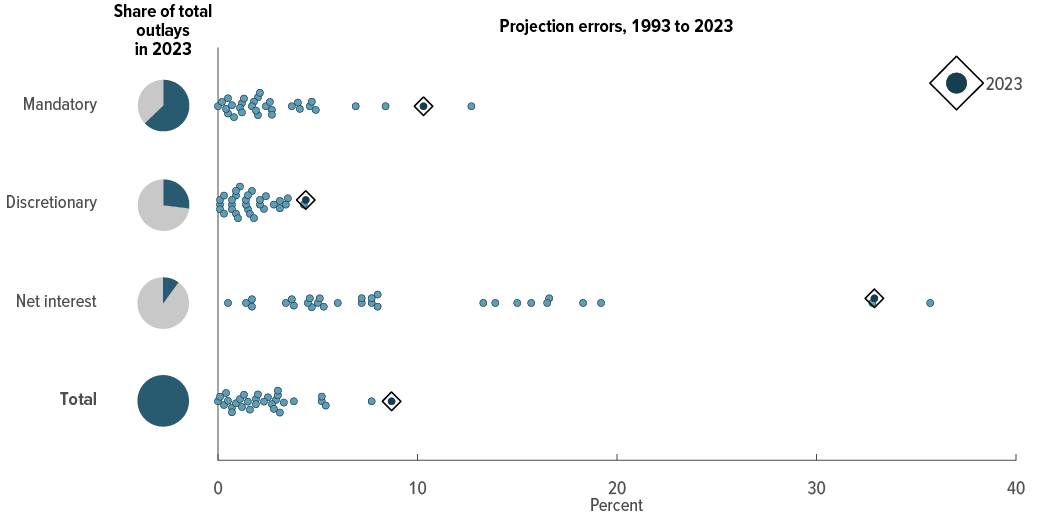
Data source: Congressional Budget Office. See www.cbo.gov/publication/59682#data.
The errors shown are for budget-year projections for 1993 to 2023. The budget year is the second year of the period covered by CBO’s baseline projections; it usually begins several months after a spring baseline is released.
CBO calculated projection errors by subtracting the actual amount from the projected amount and dividing that difference by the actual amount. The errors presented here are absolute errors; that is, they are shown as positive values regardless of whether they are positive or negative.
The projection errors for 2023 are based on projections published in Congressional Budget Office, The Budget and Economic Outlook: 2022 to 2032 (May 2022), www.cbo.gov/publication/57950. For this analysis, CBO adjusted those projections to include the estimated effects of subsequently enacted legislation. The analysis also excludes the effects on outlays of the Supreme Court’s June 2023 decision prohibiting the Administration from implementing its plan to forgive a portion of many borrowers’ outstanding student loan debt as well as outlays related to the activities of Fannie Mae and Freddie Mac; all those outlays are classified as mandatory.
Similarly, the errors in CBO’s projections of the three categories of outlays were historically large. CBO underestimated mandatory outlays in 2023 by 10 percent; only one of its past projections of such spending had a larger error.
CBO overestimated discretionary spending in 2023 by 4 percent—the largest error in a projection of such spending that the agency has recorded. CBO’s projections of discretionary spending have generally been close to actual amounts.
Although CBO has often overestimated net outlays for interest, the agency underestimated such outlays in its projection for 2023, by 33 percent. That is the second-largest error in a projection of net interest outlays that the agency has recorded.
How CBO’s Most Recent Projections Compare With Actual Outcomes in 2023
CBO’s most recent baseline budget projections for fiscal year 2023 were published in May 2023.20 To compare those projections with actual outcomes, CBO updated its projections to account for the enactment of subsequent legislation and adjusted them to exclude spending for Fannie Mae and Freddie Mac. In addition, CBO adjusted actual outcomes to exclude spending for Fannie Mae and Freddie Mac as well as the estimated effects on outlays of the Supreme Court’s June 2023 decision prohibiting the Administration from implementing its plan to forgive a portion of many borrowers’ outstanding student loan debt.
With those adjustments, revenues in 2023 in CBO’s May 2023 projections exceeded the actual amount collected that year by $0.4 trillion (or 8 percent)—less than the $0.5 trillion overestimate in the agency’s updated May 2022 projections. The agency’s latest projection of outlays for 2023 was much more accurate than its updated projection from May 2022, falling below the actual amount by $0.1 trillion (or 2 percent) instead of by $0.6 trillion. As a result, the 2023 deficit in the May 2023 projections was $0.5 trillion, or 2.0 percent of GDP, less than the actual amount, whereas in the updated May 2022 projections, the agency underestimated that deficit by 3.9 percent of GDP.
1. For last year’s edition of this report, see Congressional Budget Office, The Accuracy of CBO’s Budget Projections for Fiscal Year 2022 (January 2023), www.cbo.gov/publication/58603.
2. For CBO’s May 2022 projections, see Congressional Budget Office, The Budget and Economic Outlook: 2022 to 2032 (May 2022), www.cbo.gov/publication/57950.
3. The estimated effects of legislation on outlays for 2023 may be revised when CBO updates its evaluation of outlay projections. For the latest edition of that report, see Congressional Budget Office, An Evaluation of CBO’s Projections of Outlays From 1984 to 2021 (April 2023), www.cbo.gov/publication/58613. For the data that CBO uses to evaluate the accuracy of its projections of outlays, revenues, deficits, and debt, see Congressional Budget Office, “Evaluating CBO’s Projections of Components of the Federal Budget” (GitHub, updated December 2023), https://github.com/US-CBO/eval-projections.
4. For more information about the differences, see Congressional Budget Office, Accounting for Fannie Mae and Freddie Mac in the Federal Budget (September 2018), www.cbo.gov/publication/54475.
5. The average absolute error is an average of projection errors without regard to whether they are positive or negative. For outlay and revenue projections, the projection error is the projected amount minus the actual amount, divided by the actual amount. For deficit projections, the projection error is the difference between the projected and actual amounts expressed as a percentage of gross domestic product. CBO calculates the errors for deficit projections that way because if they were expressed as a percentage of the dollar value of the actual amount, relatively small differences between projected and actual amounts in years with small deficits or surpluses would result in large projection errors.
6. Removing the budgetary effects of the Supreme Court’s decision prohibiting the Administration from implementing its student loan forgiveness plan increased actual outlays by $333 billion. Removing the effects of Fannie Mae and Freddie Mac decreased projected outlays by $4 billion and increased actual outlays by $6 billion. The 2023 deficit, as reported by the Treasury, was $1.7 trillion.
7. The analysis focuses on the May 2022 baseline budget projections because CBO estimated the effects of proposed legislation affecting the 2023 budget year and beyond in relation to that baseline. CBO typically uses the technical assessments (of, for example, how quickly appropriations would be spent) and economic projections underlying its spring baseline from the previous fiscal year (in this case, the May 2022 baseline) to prepare cost estimates for legislation affecting the budget year and beyond. (The budget year is the second year of the period covered by CBO’s baseline projections; it usually begins several months after updates to the baseline projections are released in the spring.)
8. Congressional Budget Office, “CBO’s Projections of Realized Capital Gains Subject to the Individual Income Tax” (February 2023), www.cbo.gov/publication/58914.
9. Internal Revenue Service, “For California Storm Victims, IRS Postpones Tax-Filing and Tax-Payment Deadline to Nov. 16” (press release, October 16, 2023), https://tinyurl.com/m675zzhp.
10. Internal Revenue Service, “IRS Announces Delay for Implementation of $600 Reporting Threshold for Third-Party Payment Platforms’ Forms 1099-K” (press release, December 23, 2022, updated January 3, 2023), https://tinyurl.com/y3wdvcas.
11. Internal Revenue Service, “IRS Grants Penalty Relief for Corporations That Did Not Pay Estimated Tax Related to the New Corporate Alternative Minimum Tax” (press release, June 7, 2023), https://tinyurl.com/4h5bnwvc.
12. Congressional Budget Office, “Recent Changes to CBO’s Projections of Remittances From the Federal Reserve” (February 2023), www.cbo.gov/publication/58913.
13. Mandatory spending includes outlays for most federal benefit programs, such as Social Security, Medicare, and Medicaid, and certain other payments to people, businesses, nonprofit institutions, and state and local governments. It is governed by statutory criteria and is not normally controlled by the annual appropriation process. Discretionary spending is controlled by appropriation acts that specify the amount, purpose, and period of availability of funding for a broad array of government activities, such as defense, law enforcement, and transportation. Net outlays for interest consist of the government’s interest payments on debt held by the public minus interest income that the government receives.
14. The Treasury does not report discretionary and mandatory totals for accounts that include both types of outlays. For those accounts, CBO estimated the amounts that the Office of Management and Budget will ultimately categorize as mandatory and discretionary for 2023.
15. Refundable tax credits reduce a filer’s income tax liability, and if the credit exceeds the filer’s income tax liability, the government pays all or some portion of that excess to the taxpayer; that payment is recorded as an outlay.
16. Under the Federal Credit Reform Act of 1990, a program’s subsidy costs are calculated by subtracting the present value of the government’s projected receipts from the present value of its projected payments. The estimated subsidy costs can be increased or decreased in subsequent years to reflect updated assessments of the payments and receipts associated with the program. (A present value is a single number that expresses a flow of current and future income or payments in terms of an equivalent lump sum received or paid at a specific time. The present value depends on the rate of interest—the discount rate—that is used to translate future cash flows into current dollars.)
17. For more detailed discussions about the quality of CBO’s projections, see Congressional Budget Office, An Evaluation of CBO’s Projections of Outlays From 1984 to 2021 (April 2023), www.cbo.gov/publication/58613, An Evaluation of CBO’s Past Revenue Projections (August 2020), www.cbo.gov/publication/56499, and An Evaluation of CBO’s Past Deficit and Debt Projections (September 2019), www.cbo.gov/publication/55234.
18. The data necessary to calculate the projection errors for budget-year projections of revenues are available only for projections made for 1983 and beyond.
19. The data necessary to calculate the projection errors for budget-year projections of most types of spending are available only for projections made for 1993 and beyond.
20. Congressional Budget Office, An Update to the Budget Outlook: 2023 to 2033 (May 2023), www.cbo.gov/publication/59096.
At the request of the House and Senate Committees on the Budget, the Congressional Budget Office periodically reports on the accuracy of its baseline spending and revenue projections by comparing them with actual outcomes. Such evaluations help guide CBO’s efforts to improve the quality of its projections, and they are offered as background information to assist Members of Congress in their use of the agency’s estimates. Earlier editions of this report are available at www.cbo.gov/topics/budget/accuracy-projections. In keeping with CBO’s mandate to provide objective, impartial analysis, the report makes no recommendations.
Aaron Feinstein, Jennifer Shand, and James Williamson prepared the report with contributions from many members of CBO’s Budget Analysis and Tax Analysis Divisions and with guidance from Christina Hawley Anthony, Barry Blom, John McClelland, and Joshua Shakin.
Jeffrey Kling and Robert Sunshine reviewed the report. Bo Peery edited it, and R. L. Rebach created the graphics and prepared the text for publication. The report is available on CBO’s website at www.cbo.gov/publication/59682.
CBO seeks feedback to make its work as useful as possible. Please send comments to communications@cbo.gov.

Phillip L. Swagel
Director
Correction
The Congressional Budget Office has corrected this report since its original publication. Both the PDF and online versions were corrected, but for ease of reference, the location of the correction in the PDF is indicated below.
The following change was made on January 16, 2024:
Page 10, right-hand column, last line: “December 2021” was changed to “March 2022.”