Mandatory Spending
Function 650 - Social Security
Reduce Social Security Benefits for High Earners
CBO periodically issues a compendium of policy options (called Options for Reducing the Deficit) covering a broad range of issues, as well as separate reports that include options for changing federal tax and spending policies in particular areas. This option appears in one of those publications. The options are derived from many sources and reflect a range of possibilities. For each option, CBO presents an estimate of its effects on the budget but makes no recommendations. Inclusion or exclusion of any particular option does not imply an endorsement or rejection by CBO.
| Billions of Dollars | 2023 | 2024 | 2025 | 2026 | 2027 | 2028 | 2029 | 2030 | 2031 | 2032 | 2023– 2027 |
2023– 2032 |
|
| Change in Outlays | |||||||||||||
| Add a bend point at the 70th percentile of earners and reduce PIA factors over 9 years | 0 | * | * | -1 | -1 | -2 | -4 | -7 | -10 | -15 | -2 | -40 | |
| Add a bend point at the 50th percentile of earners and reduce PIA factors over 9 years | 0 | * | -1 | -2 | -4 | -7 | -12 | -18 | -27 | -38 | -7 | -109 | |
| Add a bend point at the 50th percentile of earners and reduce PIA factors over 5 years | 0 | * | -1 | -4 | -7 | -13 | -21 | -32 | -45 | -61 | -12 | -184 | |
This option would take effect in January 2024.
Estimates include budgetary effects for Social Security benefits; that spending is classified as off-budget.
PIA = primary insurance amount; * = between -$500 million and zero.
Background
Social Security is the largest single program in the federal government's budget. It comprises two parts: Old-Age and Survivors Insurance (OASI) and Disability Insurance (DI). OASI pays benefits to retired workers, their eligible dependents, and some survivors of deceased workers. DI pays benefits to disabled workers and their dependents until those workers are old enough to claim full retirement benefits under OASI.
The Social Security benefit paid to a retired worker who claims benefits at the full retirement age or to a disabled worker is called the primary insurance amount (PIA). The Social Security Administration (SSA) calculates that amount using a formula applied to a worker's average indexed monthly earnings (AIME). A worker's AIME is a measure of average taxable monthly earnings; the average is taken over the 35 years in which a retired worker received the highest annual earnings.
The SSA separates the AIME into three brackets using two threshold amounts, often called bend points. In calendar year 2022, the first bend point is $1,024 and the second bend point is $6,172. The AIME in each of the three brackets is multiplied by three corresponding factors (90 percent, 32 percent, and 15 percent) to calculate the PIA; the largest factor applies to the bracket containing the lowest average indexed earnings. The benefit formula is thus progressive; that is, because PIA factors are larger for lower earning brackets, the benefit is larger as a share of lifetime earnings for someone with a lower AIME than it is for a person with a higher AIME. The bend points change each year with average wages, but the PIA factors do not change.
Key Design Choices
One way to reduce benefits for high earners is to decrease the share of their AIME that is counted in the PIA by adding a bend point in the PIA formula and changing the PIA factors for new beneficiaries with higher lifetime earnings. Three key design choices, with important implications for both budgetary savings and beneficiaries, would have to be made:
- Where to set the new bend point;
- What change to make to the PIA factors; and
- How to phase in the policy.
New Bend Point. Under current law, there are two bend points—the thresholds at which PIA factors change—in the benefit calculation formula. Adding a bend point would split one bracket, resulting in a total of four brackets. Where the new bend point was set would affect the number of beneficiaries whose benefits would change. It would also affect how much those beneficiaries' benefits would change.
PIA Factors. Reducing PIA factors would decrease the benefit amount for certain workers. Only new beneficiaries with an AIME at or above the bend points being multiplied by a lower PIA factor (compared with those PIA factors under current law), would be affected. The lower the PIA factors and the lower the new bend point, the larger the number of beneficiaries that would be affected and the larger the benefit cut that the affected beneficiaries would receive.
Phase-in Period. Phasing in the change to the benefit calculation would avoid an abrupt drop in benefits for workers who were about to retire. A longer phase-in period would allow more time for beneficiaries to respond to the change. However, savings during the phase-in period would be smaller than those under an alternative that fully implemented the lower PIA factors in a shorter time.
Option
This option would create an additional bend point in the PIA formula and would change the PIA factors for new beneficiaries with higher lifetime earnings. People already receiving Social Security benefits would not be affected. The option consists of three alternatives, each of which would be phased in starting in January 2024.
Under the first alternative, a bend point would be added at the 70th percentile of earners—that is, about 70 percent of newly eligible beneficiaries would have an AIME below the new bend point. That bend point would be about $5,880 (in 2022 dollars). The bottom 70 percent of newly eligible beneficiaries would receive the same benefits as under current law; the top 30 percent of newly eligible beneficiaries (those whose AIME was at or above the new bend point) would receive smaller benefits than under current law.
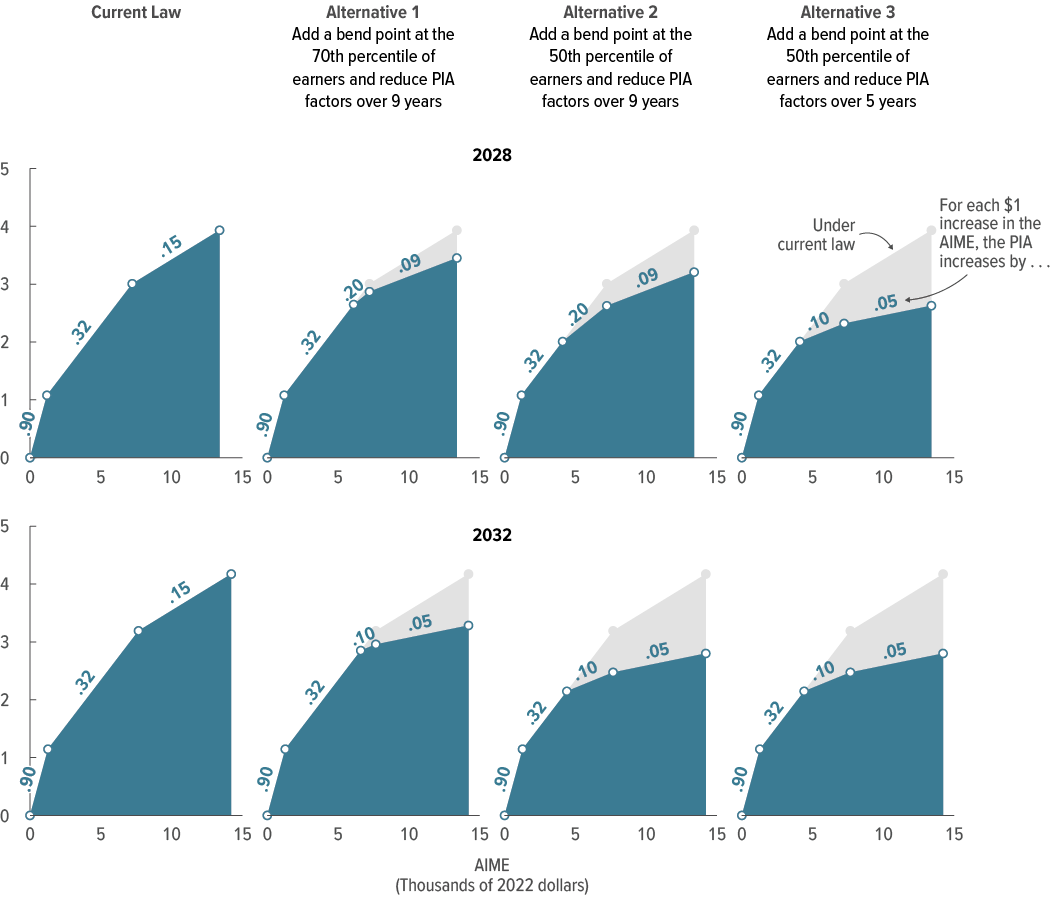
PIA factors would also change under this alternative. The PIA factor for the lowest bracket would remain at 90 percent, and the factor would remain at 32 percent for the second-lowest bracket (although that bracket would be smaller than it is under current law). The PIA factor applied between the new bend point and the highest bend point would decrease from 32 percent to 10 percent, and the PIA factor applied above the highest bend point would be reduced from 15 percent to 5 percent. Those changes would be phased in over nine years (see the figure below).
Calculating Initial Social Security Benefits With Additional Bend Point Alternatives
PIA (Thousands of 2022 dollars)
Data source: Congressional Budget Office. See www.cbo.gov/publication/58164#data.
All three alternatives would be phased in starting in 2024. In 2028, the third alternative would be fully phased in. In 2032, the first and second alternatives would be fully phased in.
AIME = average indexed monthly earnings; PIA = primary insurance amount.
Under the second alternative, the additional bend point would be set at the 50th percentile of earners. The new bend point would be about $3,930 (in 2022 dollars). PIA factors would also change under this alternative. Like in the first alternative, they would be set at 90 percent, 32 percent, 10 percent, and 5 percent, and the changes would be phased in over nine years.
Under the third alternative, the new bend point would be added at the 50th percentile, as in the second alternative. PIA factors would change as in the first two alternatives and would be set at 90 percent, 32 percent, 10 percent, and 5 percent. However, unlike in the first two alternatives, the change to the PIA factors would be phased in over five years.
After implementation, benefits for all newly eligible beneficiaries would still increase over time, although people with relatively high lifetime earnings who were affected by this option would receive smaller benefits than they would under current law. The benefits for people with earnings below the new bend point would be unchanged from those scheduled under current law. Real benefits—that is, benefits adjusted to remove the effects of inflation—would be larger for future cohorts than for current cohorts.
Effects on the Budget
The first alternative, which would add a bend point at the 70th percentile of earners, would reduce Social Security outlays by a total of $40 billion through 2032, the Congressional Budget Office estimates. The second alternative, which would create an additional bend point at the 50th percentile, would reduce Social Security outlays by a total of $109 billion through 2032. And the third alternative would decrease Social Security outlays by $184 billion through 2032 because the changes would be phased in over a shorter period than in the second alternative.
Those estimates are based on CBO's projections of the number of beneficiaries who would be affected by the option and the average reduction in their benefits. Under the first alternative, CBO estimates that in 2032, about 30 percent of new beneficiaries would be affected and would receive smaller benefits than they would under current law. On average, those people would receive an average of 12 percent less in benefits under the first alternative than under current law.
Setting the new bend point at a lower percentile of the earnings distribution would affect more beneficiaries and reduce benefits by more for the people affected. As a result, the 10-year savings under the second alternative would be more than two-and-a-half times the savings under the first alternative. In 2032, under the second alternative, about half of new beneficiaries would receive benefits that were smaller than those they would receive under current law, CBO estimates. The people affected would receive an average of 20 percent less in benefits.
Benefits would be reduced more quickly and by larger amounts for affected beneficiaries under the shorter phase-in period of the third alternative. The 10-year savings under the third alternative would therefore be about 70 percent larger than the estimated savings under the second alternative. Under the third alternative, as under the second one, about half of new beneficiaries would receive benefits that are smaller than under current law in 2032. On average, those people affected would receive 20 percent less. About half of beneficiaries—those with lower lifetime earnings—would not receive smaller benefits under this alternative.
Uncertainty About the Budgetary Effects
The overall savings from this option could be larger or smaller than shown for at least two reasons. First, savings may differ from those projected here because earnings may evolve differently than CBO currently projects. The share of workers with an AIME above the new bend point in the next 10 years is uncertain, and so savings from reducing benefits for those workers are also uncertain. Second, if the option induced beneficiaries to change when they claimed benefits, the short-term reductions in Social Security outlays could be very different than projected because the number of beneficiaries would change.
Changes in when people began claiming benefits would not alter lifetime benefits significantly, and the uncertainty about those changes would matter less in the long run than in the short term. That is because annual benefit amounts depend more on when people claim than lifetime benefits do. People who claim before their full retirement age receive smaller annual benefits than their full benefit amount but collect benefits for a longer time until they die, and people who claim after their full retirement age receive larger annual benefits because they will receive the delayed retirement credit, but they collect benefits for a shorter period.
Long-Term Effects
Annual savings from all three alternatives would continue to grow after 2032 as the new benefit structure applied to more beneficiaries. In all three alternatives, only people who were born in 1962 or later would be affected. Benefits paid to people born before 1962 would continue to be subject to the same formula as under current law. By the 2050s, nearly all beneficiaries would have been born in 1962 or later and the percentage of the beneficiaries receiving benefits under the new structure would approach 100 percent. Thereafter, the savings from this option would stabilize.
Social Security outlays under the first alternative would be 1 percent lower in 2032 than under current law and 5 percent lower in 2052. When measured as a percentage of total economic output, the program's outlays would total 6.0 percent of gross domestic product (GDP) in 2052, 0.3 percentage points lower than CBO projects under current law.
Under the second alternative, Social Security outlays would be 2 percent lower in 2032 and 11 percent lower in 2052 than under current law. When measured as a share of GDP, those outlays would be 0.7 percentage points lower in 2052 than scheduled under current law.
The third alternative would reduce Social Security outlays by 3 percent in 2032 relative to outlays scheduled under current law. In 2052, it would lower them by 12 percent (or 0.8 percentage points of GDP).
Those projections reflect the assumption that Social Security will continue to pay benefits as scheduled under current law, regardless of the status of the program's trust funds. CBO projects that, combined, the Social Security trust funds will be exhausted in calendar year 2033. Beyond that point, trust fund balances would no longer be available to make up the gap between benefits specified in current law and annual trust fund receipts. If CBO were to analyze a scenario in which benefits were limited to the amounts payable from dedicated funding sources after trust fund exhaustion, those payable benefits would be smaller than scheduled benefits beginning in 2034.
The three alternatives would also affect other measures of the Social Security program in the long term. The program has both dedicated revenue sources (in the form of payroll taxes paid by employees, employers, and self-employed people and income taxes on benefits) and trust funds. The sustainability of a program with those features is often measured by its estimated actuarial balance, which is the sum of the present value of annual income over a given period and the initial balance in the trust fund for that period, minus the sum of the present value of annual outlays over that period and the present value of a year's worth of benefits at the end of the period. For Social Security, that difference is traditionally presented as a percentage of the present value of taxable payroll or GDP over 75 years. A present value is a single number that expresses a flow of past and future income (in the form of tax revenues and other income) or payments (in the form of benefits and other outlays) in terms of an equivalent lump sum received or paid at a specific time. The value depends on the rate of interest, known as the discount rate, used to translate past and future cash flows into current dollars at that time.
The Social Security program is currently projected to have a negative actuarial balance (or an actuarial shortfall) over 75 years. All three alternatives would improve the program's 75-year actuarial balance. Considered as a share of GDP, the actuarial shortfall would decline by about 0.3 percentage points (about a 15 percent improvement compared with an actuarial shortfall of 1.7 percent of GDP under current law) under the first alternative. The second and third alternatives would both improve the 75-year actuarial balance, considered as a share of GDP, by 0.6 percentage points, a reduction of more than one-third from what would occur under current law.
Estimates of the actuarial balance do not account for revenues or outlays after the 75-year projection period. Outlays are projected to be larger than revenues at the end of that period, and although all three alternatives would shrink that gap relative to current law, none of the alternatives would eliminate it. In each case, that gap would persist after the 75th year. To put Social Security on a stable path beyond the 75th year, a policy would need to do more to address the gap between revenues and outlays.
Another common measure of Social Security's sustainability is a trust fund's date of exhaustion—the year in which its balance will reach zero. In CBO's projections, the combined Old-Age, Survivors, and Disability Insurance (OASDI) trust funds are exhausted in calendar year 2033. All three alternatives would delay the combined trust funds' projected exhaustion date by 1 year.
Distributional Effects
The Social Security program, on net, is progressive—that is, the benefits received from the program, measured relative to taxes paid into the program over the beneficiary's lifetime, tend to be higher for lower-income households than for higher-income households. This option would increase that progressivity. It would continue to provide the same Social Security benefits as scheduled under current law to people who have low lifetime earnings while reducing payments relative to current law for people with higher lifetime earnings.
This discussion focuses on two ways to examine the distributional effects of a change in Social Security benefits. One is to evaluate how the fully implemented changes would affect the distribution of household income in a given year. The other is to estimate the changes to the benefits people receive over their lifetime and how that would vary along the distribution of lifetime household earnings.
In a given year after implementation, the alternatives described here would reduce the income of people in higher-income households by more than they would reduce income for people in lower-income households when compared with incomes under current law. Most Social Security beneficiaries are age 65 or older. In CBO's baseline distribution of household income after transfers and taxes, income includes Social Security benefits. As a result, people in that age group are slightly more likely than others to be in higher-income households. Moreover, within that group, all of the alternatives described here would reduce benefits and income after taxes and transfers for higher-income beneficiaries but leave benefits and income after taxes and transfers for beneficiaries with lower income unchanged.
When considered in isolation, Social Security taxes are regressive—that is, people with higher earnings (in particular, those with earnings above the taxable maximum) pay a smaller percentage of their total earnings in payroll taxes than those with lower earnings. However, the regressivity of Social Security taxes is counterbalanced by the progressivity of Social Security benefits. Specifically, people with lower earnings during their lifetime tend to receive a larger share of their earnings in benefits over their lifetime. Two factors contribute to the progressivity of benefits: First, the benefit formula replaces a larger share of earnings for people with lower lifetime earnings; and, second, people with lower lifetime earnings are more likely than average to receive disability benefits. Those factors are partially offset by the fact that people with higher lifetime earnings tend to live longer than average, which means that they collect retired-worker benefits for more years. Although the benefits received by people with lower earnings tend to be larger as a share of earnings over their lifetime, people with high earnings, on average, collect more in total benefits. This option would reduce that difference in total lifetime benefits and increase the progressivity of the program.
This option would also have different effects depending on when beneficiaries were born. Because the option would be phased in over either five or nine years, there would be no effects on current beneficiaries, and among new beneficiaries, the effects would be smaller for people who became eligible before the alternatives were fully phased in.
Considering the combined effects for people with different average lifetime earnings and for people who were born at different times, CBO expects that, under all the alternatives discussed here, the ratio of average lifetime benefits to average lifetime earnings would remain about the same or would be lower than under current law for people in all quintiles (or fifths) of the lifetime household earnings distribution. (Lifetime benefits in this analysis include the present value of all Social Security benefits except those received by young widows, young spouses, and children. The values of benefits are net of income taxes that some recipients pay on their benefits.)
For people in the lowest quintile, those changes would be 1 percent or less (see the table below). Some people in that lowest quintile would see their benefits reduced because, in this analysis, people are ranked based on their lifetime household earnings. In the case of married couples, one individual may have relatively high lifetime earnings whereas that person's spouse may have very low lifetime earnings. Because their lifetime household earnings are equal to the average of their earnings, they may both be included in the bottom fifth of the household earnings distribution. In that case, the higher earning spouse would see reduced benefits under the option, but the lower earning spouse would not. That results in showing a small decrease in benefits, on average, for that lowest quintile.
| Changes to Social Security Benefits Relative to Earnings for Different Groups If a New Bend Point Was Added | |||||||||
| Percent | Lifetime Household Earnings Quintilea | Average Lifetime Benefits Relative to Lifetime Earnings for Beneficiaries, by 10-Year Birth Cohort | |||||||
| 1960s | 1970s | 1980s | 1990s | ||||||
| Under Current Law | |||||||||
| No change | Lowest | 33 | 35 | 34 | 32 | ||||
| Middle | 19 | 20 | 19 | 17 | |||||
| Highest | 8 | 8 | 8 | 7 | |||||
| Percentage Change From Current Lawb | |||||||||
| Add a bend point at the 70th percentile of earners and reduce PIA factors over 9 years | Lowest | * | * | * | * | ||||
| Middle | * | -1 | -1 | * | |||||
| Highest | -6 | -14 | -15 | -14 | |||||
| Add a bend point at the 50th percentile of earners and reduce PIA factors over 9 years | Lowest | * | -1 | -1 | * | ||||
| Middle | -3 | -8 | -7 | -8 | |||||
| Highest | -10 | -25 | -26 | -26 | |||||
| Add a bend point at the 50th percentile of earners and reduce PIA factors over 5 years | Lowest | * | * | -1 | -1 | ||||
| Middle | -4 | -8 | -7 | -6 | |||||
| Highest | -15 | -26 | -26 | -26 | |||||
Data source: Congressional Budget Office. See www.cbo.gov/publication/58164#data.
PIA = primary insurance amount; * = between -1 percent and zero.
a. The lowest, middle, and highest fifths of people within a 10-year birth cohort ranked by lifetime household earnings. For someone who is single in all years, lifetime household earnings equal the present value of inflation-adjusted earnings over that person's lifetime. In any year in which a person is married, the lifetime household earnings equal the average of the couple's earnings, adjusted for economies of scale in household consumption.
b. Each alternative's effect is measured as a percentage change from the current-law value. For example, under current law, the ratio of average lifetime benefits to lifetime earnings for high earners born in the 1990s will be 7 percent, CBO estimates. If a bend point was added at the 70th percentile of earners and changes to PIA factors were phased in over 9 years, the 1 percentage-point decrease in that ratio—from 7 percent to 6 percent—is expressed as a 14 percent decrease in this table.
The effects on people with higher earnings would vary more among the three alternatives. For all the alternatives, the reduction relative to current law in lifetime benefits as a percentage of lifetime earnings would be greatest, on average, for people in the highest quintile of the earnings distribution. For example, such people born in the 1980s and 1990s would see a 26 percent reduction in that measure under the second and third alternatives. Those effects would be larger under the second alternative than under the first one. The faster phase-in under the third alternative means that the effects on those born in the 1960s would be larger under the third alternative than under the second one.
Economic Effects
In addition to having the behavioral effects reflected in conventional budget estimates, such as the ones shown above, benefit reductions would affect the economy, and those effects would evolve over time as people adjusted their behavior in response to the policy change.
First, some future beneficiaries would probably increase their savings while they were working to offset the reduction in Social Security benefits. Second, the reduction in benefits would probably induce some older workers to work more hours or to delay retirement and remain in the labor force longer than they would have otherwise.