From 1979 to 2007, real (inflation-adjusted) average household income, measured after government transfers and federal taxes, grew by 62 percent. That growth was not equal across the income distribution: Income after government transfers and federal taxes (denoted as after-tax income) for households at the higher end of the income scale rose much more rapidly than income for households in the middle and at the lower end of the income scale.
In a study prepared at the request of the Chairman and former Ranking Member of the Senate Committee on Finance, CBO examines the trends in the distribution of household income between 1979 and 2007. (Those endpoints allow comparisons between periods of similar overall economic activity.)
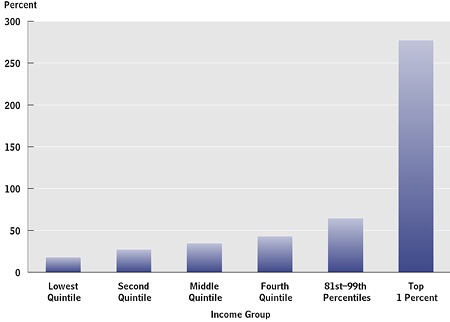
After-Tax Income Grew More for the Highest-Income Households
CBO finds that between 1979 and 2007:
- For the 1 percent of the population with the highest income, average real after-tax household income grew by 275 percent (see figure below).
- For others in the 20 percent of the population with the highest income, average real after-tax household income grew by 65 percent.
- For the 60 percent of the population in the middle of the income scale, the growth in average real after-tax household income was just under 40 percent.
- For the 20 percent of the population with the lowest income, the growth in average real after-tax household income was about 18 percent.
| Growth in Real After-Tax Income from 1979 to 2007 |
 |
As a result of that uneven income growth, the distribution of after-tax household income in the United States was substantially more unequal in 2007 than in 1979: The share of income accruing to higher-income households increased, whereas the share accruing to other households declined. Specifically:
- The share of after-tax household income going to the highest income quintile grew from 43 percent in 1979 to 53 percent in 2007. (Each quintile contains one-fifth of the population, ranked by adjusted household income.)
- The share of after-tax household income for the 1 percent of the population with the highest income more than doubled, climbing from nearly 8 percent in 1979 to 17 percent in 2007.
- The population in the lowest income quintile received about 7 percent of after-tax household income in 1979; by 2007, their share of after-tax income fell to about 5 percent. The middle three income quintiles all saw their shares of after-tax income decline by 2 to 3 percentage points between 1979 and 2007.
Market Income Shifted Toward Higher-Income Households
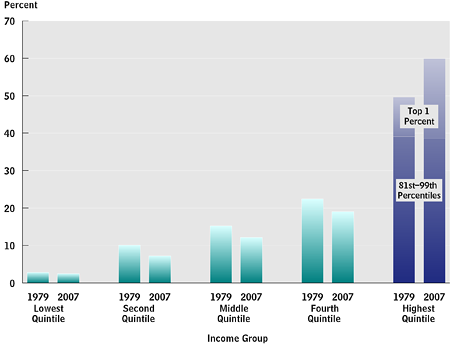
The major reason for the growing unevenness in the distribution of after-tax income was an increase in the concentration of market income—income measured before government transfers and taxes—in favor of higher-income households. Specifically, over the 1979 to 2007 period, the highest income quintile’s share of market income increased from 50 percent to 60 percent (see figure below), while the share of market income for every other quintile declined. In fact, the distribution of market income became more unequal almost continuously between 1979 and 2007 except during the recessions in 1990–1991 and 2001.
| Shares of Market Income, 1979 and 2007 |
 |
Two factors accounted for the changing distribution of market income. One was an increase in the concentration of each source of market income, which consists of labor income (such as cash wages and salaries and employer-paid health insurance premiums), business income, capital gains, capital income, and other income. All of those sources of market income were less evenly distributed in 2007 than they were in 1979.
The other factor was a shift in the composition of market income. Labor income has been more evenly distributed than capital and business income, and both capital income and business income have been more evenly distributed than capital gains. Between 1979 and 2007, the share of income coming from capital gains and business income increased, while the share coming from labor income and capital income decreased.
Market Income Grew Rapidly for the Highest-Income Households
The rapid growth in average real household market income for the 1 percent of the population with the highest income was a major factor contributing to the growing dispersion of income. Average real household market income for the highest income group tripled over the period, whereas such income increased by about 19 percent for a household at the midpoint of the income distribution. As a result, the share of total market income received by the top 1 percent of the population more than doubled between 1979 and 2007, growing from about 10 percent to more than 20 percent.
The precise reasons for the rapid growth in income at the top are not well understood, though researchers have offered several potential rationales, including technical innovations that have changed the labor market for superstars (such as actors, athletes, and musicians), changes in the governance and structure of executive compensation, increases in firms’ size and complexity, and the increasing scale of financial-sector activities.
The composition of income for the 1 percent of the population with the highest income changed significantly from 1979 to 2007, as the shares from labor and business income increased and the shares of income represented by capital income decreased as a share of their income.
Government Transfers and Federal Taxes Became Less Redistributive
Although an increasing concentration of market income was the primary force behind growing inequality in the distribution of after-tax household income, shifts in government transfers (cash payments to individuals and estimates of the value of in-kind benefits) and federal taxes also contributed to that increase in inequality. CBO estimates that the dispersion of market income grew by about one-quarter between 1979 and 2007, while the dispersion of income after government transfer and federal taxes grew by about one-third.
Because government transfers and federal taxes are both progressive, the distribution of after-transfer, after-federal-tax household income is more equal than is the distribution of market income. Nevertheless, the equalizing effect of transfers and federal taxes on household income was smaller in 2007 than it had been in 1979.
Specifically, in 1979, households in the bottom quintile received more than 50 percent of transfer payments. In 2007, similar households received about 35 percent of transfers. That shift reflects the growth in spending for programs focused on the elderly population (such as Social Security and Unemployment Insurance), in which benefits are not limited to low-income households.
Likewise, the equalizing effect of federal taxes was smaller. Over the 1979–2007 period, the overall average federal tax rate fell by a small amount, the composition of federal revenues shifted away from progressive income taxes to less-progressive payroll taxes, and income taxes became slightly more concentrated at the higher end of the income scale. The effect of the first two factors outweighed the effect of the third, reducing the extent to which taxes lessened the dispersion of household income.
This study was prepared by Edward Harris and Frank Sammartino of CBO’s Tax Analysis Division.