CBO just released its annual analysis of the President’s budget, so it seems like a good time to update a comparison of alternative budget plans I included in a lecture I gave a few weeks ago.
CBO’s Baseline Projections
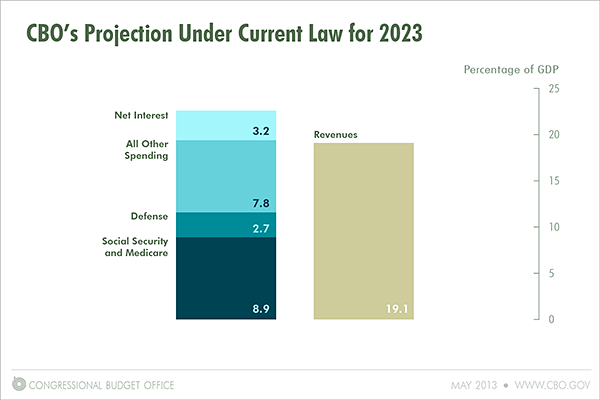
The following figure summarizes our projections of federal spending and revenues for 2023 under current law. (That year is the last year of the current 10-year budget window that is the focus of CBO’s projections and cost estimates for pending legislation.) The category labeled “All Other Spending” includes all noninterest spending apart from Social Security, Medicare, and national defense; thus, it includes spending for Medicaid, subsidies to be provided through health insurance exchanges, the Supplemental Nutrition Assistance Program (formerly known as Food Stamps), unemployment compensation, veterans’ benefits, federal civilian and military retirement benefits, transportation programs, education and training, and many other government activities.
For 2023 under current law, CBO projects that federal spending would be 22.6 percent of GDP and federal revenues would be 19.1 percent of GDP (both above their 40-year averages of 21.0 percent and 17.9 percent, respectively). The resulting deficit would be 3.5 percent of GDP (compared with an average of 3.1 percent over the past 40 years and 2.4 percent in the 40 years before fiscal year 2008). Relative to GDP, spending on Social Security and Medicare would be well above its 40-year average, spending on defense would be well below that average, and all other noninterest spending would have the same share of GDP that it has averaged during the past 40 years. Within that broad category, spending for health programs would be larger relative to its past average and spending for non-health programs would be smaller.
The President’s 2014 Budget Proposals
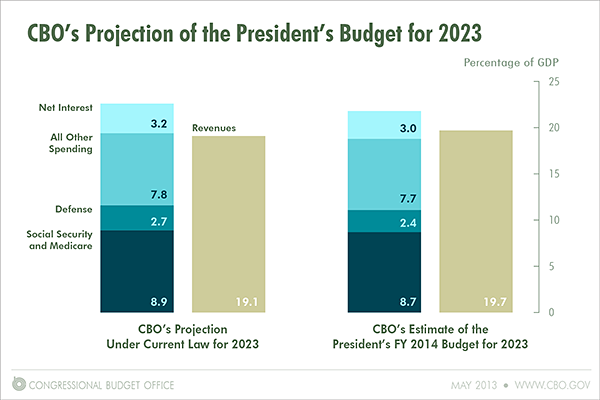
The next figure shows CBO’s estimate of the effects of the President’s budget proposals (on the right) compared with current law (on the left). For 2023, the President’s proposals would raise revenues by 0.6 percent of GDP and lower noninterest spending by 0.6 percent of GDP (with small net reductions in spending on Medicare, defense, and other programs). The changes in revenues and spending over the whole decade would reduce interest payments in 2023 by 0.2 percent of GDP. The resulting deficit for that year would be 2.1 percent of GDP.
Congressional Budget Plans
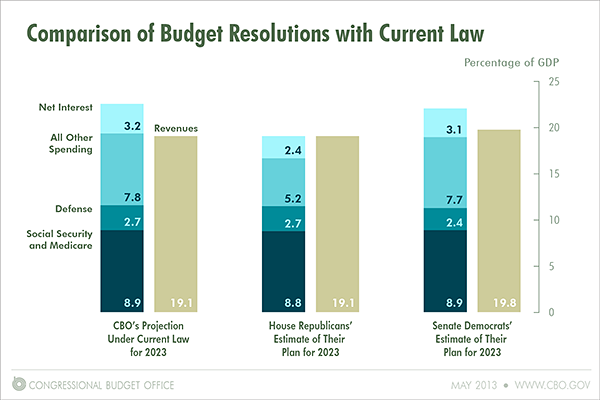
CBO does not analyze Congressional budget resolutions. Moreover, the budget resolutions passed by the House and Senate were based on CBO’s February projections under current law, and we released updated projections earlier this week. Nevertheless, it is interesting to compare our latest projections of what would happen to spending and revenues under current law with the House Republicans’ estimate of their budget plan and the Senate Democrats’ estimate of their budget plan from March. The next figure presents that comparison.
House Republicans estimate that their plan would balance the budget in 2023. Relative to current law for that year, they would leave revenues and spending for defense and for Social Security and Medicare at roughly the same shares of GDP. However, they would cut all other noninterest spending taken together by about one-third.
Senate Democrats estimate that their plan would reduce the deficit to about 2 percent of GDP in 2023. Relative to current law for that year, they would raise revenues, reduce defense spending, and leave spending for Social Security and Medicare and for all other noninterest purposes at roughly the same shares of GDP. (Both the House and Senate budget plans would make substantial changes to revenues and spending within the broad categories shown here.)
Congressional Plans Compared With President’s Proposals
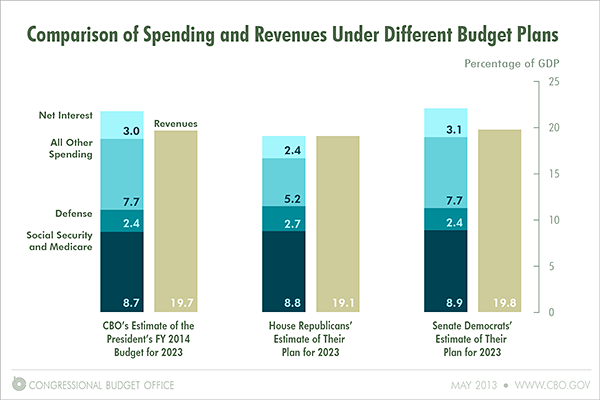
It is also interesting to compare our estimates of the spending and revenues implications of the President’s budget with the House Republicans’ and Senate Democrats’ estimates of their respective plans. The next figure summarizes that comparison (with the same caveats mentioned above).
The Senate Democrats’ estimate of their plan shows federal revenues and broad categories of federal spending fairly close to what CBO estimates they would be under the President’s budget. However, the House Republicans’ estimate of their plan shows federal revenues notably smaller, and noninterest spending apart from Social Security and Medicare roughly one-third smaller, than CBO estimates that they would be under the President’s budget.
Federal Debt Under Alternative Plans
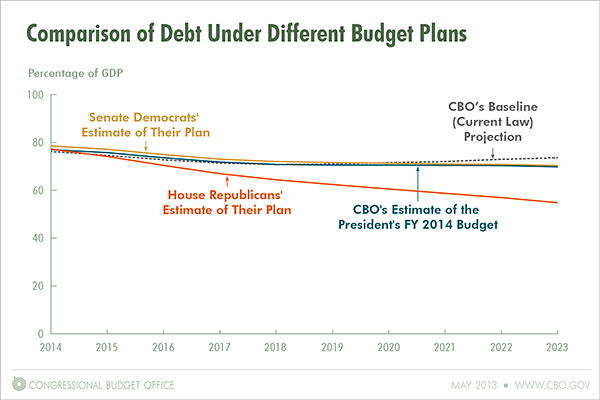
The final figure shows federal debt held by the public under current law (as estimated by CBO), the President’s budget (as estimated by CBO), and the two Congressional budget resolutions (as estimated by the House Republicans and Senate Democrats).
CBO projects that, under current law, debt will be 74 percent of GDP in 2023 and on an upward path. For that same year under the President’s budget, CBO projects that debt will be 70 percent of GDP and declining slightly relative to the size of the economy. The Senate Democrats estimate that their plan would also lead to debt close to 70 percent of GDP in 2023, whereas the House Republicans estimate that their plan would lead to debt around 55 percent of GDP in that year.
