CBO recently released The Budget and Economic Outlook: 2014 to 2024. In that report, CBO projects that if current laws remain in place, the federal budget deficit will total $514 billion in fiscal year 2014. That deficit will be $166 billion smaller than the figure posted in 2013 and down sharply from the shortfalls recorded between 2009 and 2012, which exceeded $1 trillion annually. At 3.0 percent of gross domestic product (GDP), this year’s deficit would be near the average experienced over the past 40 years and about 7 percentage points lower than the figure recorded in 2009.
Today’s post summarizes CBO’s assessment of the budget outlook over the next decade. Three more posts—to appear over the next several days—will provide more detail about the outlook for spending, revenues, and the economy. One more post will expand upon CBO’s economic forecast, explaining the reasons behind the slow recovery of the labor market.
Under Current Law, Federal Debt Will Grow to 79 Percent of GDP at the End of 2024, CBO Estimates
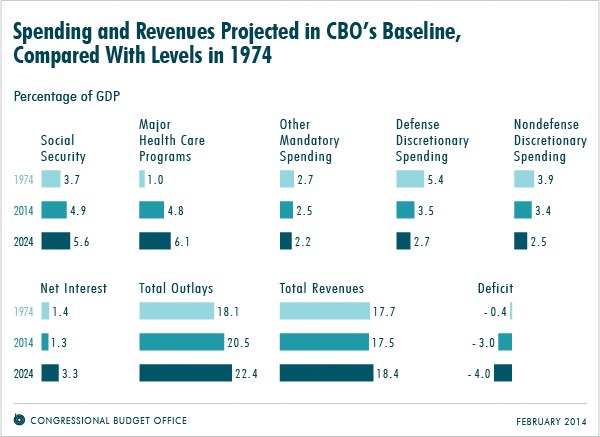
CBO constructs it baseline projections of federal revenues and spending over the coming decade under the assumption that current laws generally remain unchanged. Under that assumption, revenues are projected to grow by about 1 percentage point of GDP over the next 10 years—from 17.5 percent in 2014 to 18.4 percent in 2024. But outlays are projected to rise twice as much, from 20.5 percent of GDP in 2014 to 22.4 percent in 2024. The increase in outlays reflects substantial growth in the cost of the largest benefit programs—Social Security, Medicare, and Medicaid—and in payments of interest on the government’s debt; those increases would more than offset a significant decline in discretionary spending relative to the size of the economy.
Although the deficit in CBO’s baseline projections continues to decline as a percentage of GDP in 2015, to 2.6 percent, it then starts to increase again in 2016, reaching 4.0 percent of GDP in 2024. That figure for the end of the 10-year projection period is roughly 1 percentage point above the average deficit over the past 40 years relative to the size of the economy.
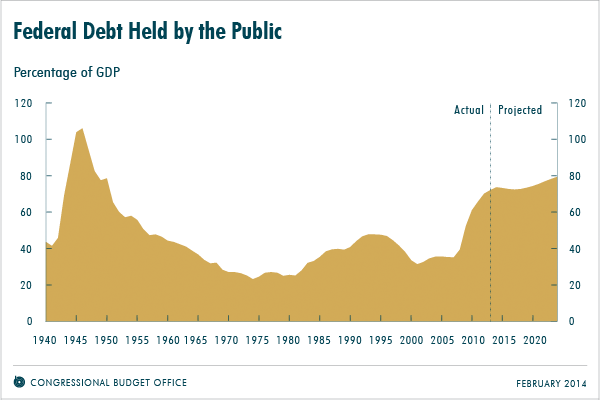
That pattern of lower deficits initially, followed by higher deficits for the remainder of the projection period, would cause debt held by the public to follow a similar trajectory (see the figure below). Relative to the nation’s output, debt held by the public is projected to decline from 74 percent of GDP in 2014 to 72 percent of GDP in 2017, but to rise thereafter, to 79 percent of GDP at the end of 2024. (As recently as the end of 2007, debt held by the public was equal to 35 percent of GDP.)

In the past few years, debt held by the public has been significantly greater relative to GDP than at any time since just after World War II, and under current law it will continue to be quite high by historical standards during the next decade. With debt so large, federal spending on interest payments will increase substantially as interest rates rise to more typical levels. Moreover, because federal borrowing generally reduces national saving, the capital stock and wages will be smaller than if debt was lower. In addition, lawmakers would have less flexibility than they otherwise would to use tax and spending policies to respond to unanticipated challenges. Finally, such a large debt poses a greater risk of precipitating a fiscal crisis, during which investors would lose so much confidence in the government’s ability to manage its budget that the government would be unable to borrow at affordable rates. (For a discussion of the consequences of elevated debt, see CBO’s December 2013 report Choices for Deficit Reduction: An Update.)
Projected Deficits Reflect Substantial Growth in the Cost of the Largest Benefit Programs
Projected deficits and debt for the coming decade reflect some of the long-term budgetary pressures facing the nation. The aging of the population, the rising costs of health care, and the expansion in federal subsidies for health insurance that is now under way will substantially boost federal spending on Social Security and the government’s major health care programs by 2 percentage points of GDP over the next 10 years (see the figure below). But the pressures of aging and the rising costs of health care will intensify during the next few decades. Unless the laws governing those programs are changed—or the increased spending is accompanied by corresponding reductions in other spending relative to GDP, by sufficiently higher tax revenues, or by a combination of those changes—debt will rise sharply relative to GDP after 2024. (For a more detailed discussion of the long-term budget situation, see CBO’s September 2013 report The 2013 Long-Term Budget Outlook.)

Moreover, holding discretionary spending within the limits required under current law—an assumption that underlies these projections—may be quite difficult. The caps on discretionary budget authority established by the Budget Control Act of 2011 (Public Law 112-25) and subsequently amended will reduce such spending to an unusually small amount relative to the size of the economy. With those caps in place, CBO projects, discretionary spending will equal 5.2 percent of GDP in 2024; by comparison, the lowest share for discretionary spending in any year since 1962 (the earliest year for which such data have been reported) was 6.0 percent in 1999. (Nevertheless, total federal spending would be a larger share of GDP than its average during the past 40 years because of higher spending on Social Security, Medicare, Medicaid, other health insurance subsidies for low-income people, and interest payments on the debt.) Because the allocation of discretionary spending is determined by annual appropriation acts, lawmakers have not yet decided which specific government services and benefits will be reduced or constrained to meet the specified overall limits.
The Budget Outlook for the Coming Decade Has Worsened Since May 2013
The baseline budget outlook has worsened since May 2013, when CBO last published its 10-year projections. A description of the changes in CBO’s baseline since May 2013 can be found in Appendix A of the report. At that time, deficits projected under current law totaled $6.3 trillion for the 2014–2023 period, or about 3 percent of GDP. Deficits are now projected to be about $1 trillion larger. The bulk of that change occurred in CBO’s estimates of revenues: The agency has reduced its projection of total revenues by $1.6 trillion, mostly because of changes in the economic outlook. A decrease of $0.6 trillion in projected outlays through 2023 partially offset that change.
Barry Blom is an analyst in CBO’s Budget Analysis Division and Leigh Angres is special assistant to the CBO Director.

