
Notes
Notes
All years referred to in this report are calendar years.
Numbers in the text and tables may not add up to totals because of rounding.
Summary
Each year, the Congressional Budget Office updates its projections of the Social Security system’s finances to incorporate newly available data and methodological improvements. CBO published its latest long-term budget projections in June 2019. This report compares those with the ones CBO prepared in 2018 and with the latest projections by the Social Security trustees.
CBO’s June 2019 projections of the Social Security system’s financial outlook are similar to those it produced last year (see Table 1):
Table 1.
Changes to CBO’s Projections of the 75-Year Actuarial Balance

Source: Congressional Budget Office.
DI = disability insurance; GDP = gross domestic product; * = between –0.05 and 0.05 percent.
The 75-year projection period for the financial measures reported here begins in 2019 and ends in 2093. The 75-year period for the June 2018 projections began in 2018 and ended in 2092. The projections incorporate the assumption that spending for Social Security continues as scheduled even if its trust funds are exhausted.
The actuarial balance is the sum of the present value of projected tax revenues and the current trust fund balance minus the sum of the present value of projected outlays and a year’s worth of benefits at the end of a given period, divided by the present value of GDP or taxable payroll. (A present value expresses a flow of past and future revenues or outlays as a single amount received or paid at a specific time. The value depends on the rate of interest, known as the discount rate, used to translate past and future cash flows into a single number.)
- The projected 75-year actuarial balance, a commonly used measure of the system’s financial condition, has not changed as a percentage of gross domestic product (GDP) since last year, remaining at −1.5 percent of GDP (that is, a deficit of 1.5 percent).
- As a percentage of taxable payroll, the projected 75-year actuarial balance has worsened slightly, moving from −4.4 percent to −4.6 percent.
That change in the system’s outlook results from several factors.
- Worsening the outlook are reduced projections of interest rates, the inclusion of another year (2093) with a relatively large difference between Social Security’s revenues and outlays, and some technical changes.
- Improving the outlook are higher overall rates of projected labor force participation, lower projections of the number of workers who are awarded disability benefits, and the slightly lower projected share of the population that is age 65 or older.
For the 2018–2093 period, CBO projects larger deficits in Social Security’s finances than do the Social Security trustees. That difference is largely explained by CBO’s and the trustees’ different projections of several key inputs into estimates of the system’s finances: the population, components of GDP growth, earnings subject to Social Security payroll taxes, and real interest rates (that is, interest rates adjusted to remove the effects of inflation).
Changes to CBO’s Long-Term Social Security Projections Since Last Year
Social Security is the largest single program in the federal budget. Created in 1935, the program pays benefits to retired workers, their eligible dependents, and some survivors of deceased workers from the Old-Age and Survivors Insurance (OASI) Trust Fund, and it makes payments to disabled workers and their dependents through the Disability Insurance (DI) Trust Fund. Although the two trust funds are legally separate, in this report CBO generally follows the common analytical convention of considering them as one combined trust fund.
A common measure of the financial status of a program that has a trust fund and a dedicated revenue source is its estimated actuarial balance over a given period—that is, the sum of the present value of projected tax revenues and the current trust fund balance minus the sum of the present value of projected outlays and a year’s worth of benefits at the end of the period.1 For Social Security, that difference between a trust fund’s resources and its spending is traditionally presented as a percentage of the present value of GDP or taxable payroll over 75 years. The actuarial balance, however, does not measure the sustainability of the Social Security system. An evaluation of the system’s sustainability must include additional measures, such as the trajectories of annual revenues and outlays beyond the 75-year period.
Although the financial outlook for Social Security in this year’s projections is similar to last year’s, some of the changes that CBO has made since last year worsened the outlook, and some improved it.2 On the one hand, the agency has lowered its projections of interest rates, changed the valuation period in the calculation of the actuarial balance, and made other technical changes, each of which has worsened the outlook. On the other hand, CBO has increased its projected rate of labor force participation, lowered its projections of the rate of disability incidence, and reduced the relative share of people age 65 or older in the population, each of which has improved the financial outlook for Social Security.
CBO evaluates the inputs underlying its 10-year and long-term budget projections and its modeling approaches annually. The inputs and approaches reflect the agency’s best assessment at that time of various demographic and economic developments as well as the effects of fiscal policy on economic activity. CBO’s annual estimate of the Social Security system’s finances is an outcome produced using those inputs.
Interest Rates
CBO has lowered its projections of interest rates over the near term and long term, which has worsened the projected actuarial balance by less than 0.05 percent of GDP, or by 0.1 percent of taxable payroll. Interest rates determine the discount rate applied in calculating the actuarial balance, which specifies how much weight is given to the annual difference between Social Security’s outlays and revenues throughout the projection period. Because lower interest rates put more weight on future years—which are projected to have larger financial shortfalls—they worsen the actuarial balance.
CBO uses two measures of interest rates to determine the discount rate used to calculate the actuarial balance. In the years before the Social Security trust funds are projected to be exhausted, CBO uses a discount rate based on the average interest rate on all bonds held by the Social Security trust funds.3 That rate is currently lower than the rate on new special-issue Treasury bonds because many of the outstanding bonds were issued at very low rates. In CBO’s projections, the average rate on all outstanding bonds moves toward the rate on new special-issue Treasury bonds in the last few years before trust fund exhaustion. In the years after the trust funds are projected to be exhausted, the agency uses a discount rate based on the projected rate for 10-year Treasury notes, which is equivalent to the projected interest rate on new special-issue bonds.
Over the 75-year projection period, the interest rates used to calculate the actuarial balance are about 0.1 percentage point lower, on average, this year than they were in last year’s projections (see Figure 1).4 In CBO’s projections, the difference between Social Security’s outlays and revenues generally widens over time, leading to larger deficits over the longer term. Because those larger future deficits are weighted more heavily when the interest rates are lower, they worsen the actuarial balance.
Figure 1.
Interest Rates Used to Calculate the Actuarial Balance
Percent

Source: Congressional Budget Office.
The interest rate used in the calculation of the actuarial balance is the average rate on all bonds held by the Social Security trust funds until their exhaustion in 2032. After the combined trust funds are projected to be exhausted, CBO, like the trustees, uses a discount rate based on the interest rate on new special-issue Treasury bonds, which CBO takes to equal the rate on 10-year Treasury notes.
Valuation Period
The change in the valuation period for the 75-year actuarial balance—from 2018 to 2092 in last year’s projections to 2019 to 2093 in this year’s projections—worsened the projected actuarial balance by less than 0.05 percent of GDP, or by 0.1 percent of taxable payroll. The actuarial balance is worsened because the change in the valuation period includes another year (2093) with a relatively large difference between Social Security’s revenues and outlays. That deficit is likely to persist beyond 2093 as the program’s outlays continue growing faster than its revenues.
Labor Force Participation Rate
For most of the projection period, CBO’s projected labor force participation rate is higher than it was last year. That change improves the projected actuarial balance by 0.1 percent of GDP, or by 0.2 percent of taxable payroll. On average, the labor force participation rate—the percentage of people in the civilian, noninstitutionalized population who are age 16 or older and are either working or actively seeking work—is slightly lower than previously projected for 2019 to 2024 and slightly higher than previously projected thereafter. The new projection incorporates CBO’s reassessment of recent trends in the participation rates of different demographic groups.
For the youngest group of workers, those ages 16 to 24, CBO has lowered its projection of the participation rate throughout the 75-year period. That group’s rate of participation in the labor force is projected to decline from about 55 percent in 2018 to 54 percent in 2048, instead of rising to 57 percent as previously projected. By 2092, that group’s labor force participation rate is projected to be about 5 percentage points lower than what was projected last year. CBO lowered its projection because the participation rate of the youngest workers in the labor force has declined substantially since the 2007–2009 recession and has not recovered meaningfully in recent years despite the growth of the economy.5
Conversely, the agency has raised its projection of the labor force participation rate for people age 55 or older, and that change has a larger effect on the outlook for Social Security. The participation rate for that group is now projected to be 0.6 percentage points higher, on average, throughout the 75-year period and about one-half of 1 percentage point higher by 2092 than what was projected last year. CBO raised its projection primarily because the participation rate for that group has rebounded more strongly in the past year than expected. That development suggests that the rate’s decline after the last recession was driven more by cyclical factors and less by structural factors than was previously estimated.
A higher labor force participation rate initially increases revenues (as the additional workers pay payroll taxes) but later increases both revenues and spending (as those workers retire and become eligible for Social Security benefits). Some of that spending occurs more than 75 years from now. In the calculation of the system’s actuarial balance, earlier years are more heavily weighted than later years and include only spending and revenues over the next 75 years. Because the larger amount of projected revenues outweighs the effect of greater spending on future benefits, the projected actuarial balance improves.
Disability Incidence
The number of people projected to claim disability insurance benefits is smaller over the next decade and in the long term than in last year’s projections. CBO lowered the number of new DI beneficiaries because the agency’s estimates of that measure in recent years have consistently been too high. This year’s downward revision reduces the total projected number of DI beneficiaries in 2092 by about 3 percent, which improves the projected actuarial balance by less than 0.05 percent of both GDP and taxable payroll.
For its long-term projections, CBO has lowered the age- and sex-adjusted rate of disability incidence—the share of workers who are awarded disability benefits in each year out of all workers who are insured under DI but not receiving benefits at the start of the year, adjusted for changes in the distribution of the population by age and sex.6 Last year, in CBO’s projections, the long-run rate of disability incidence was 5.4 people per 1,000 insured workers, and it is 5.2 people per 1,000 insured workers this year. (In CBO’s projections, the long-run disability incidence rate is reached in the 30th year of the projection period, and it remains at that rate thereafter.) The revised projection is closer to current longer-term historical averages. Specifically, the average rate of DI incidence from 1990 through 2018 (a time during which DI policy has remained fairly steady) and from 1990 through 2007 (the period covering the past two full business cycles) was about 5.2 people per 1,000 insured workers.
Population
CBO has lowered its projections of the size of the population as well as the projected share of the population age 65 or older. Those changes improved the projected actuarial balance by less than 0.05 percent of both GDP and taxable payroll. Last year, CBO projected that the population would increase from 335 million in 2019 to 476 million in 2092—an average annual growth rate of 0.5 percent. This year, CBO projects that the population would increase from approximately 333 million to 460 million, an average annual growth rate of 0.4 percent. In last year’s projections, the ratio of people age 65 or older to people ages 20 to 64 increased from 27.2 percent in 2019 to 46.3 percent in 2092. In this year’s projections, that ratio is slightly lower throughout most of the period, increasing from 27.2 percent to 46.0 percent. Those revisions reflect changes in the rates of fertility, net immigration, and mortality.7
Since the 2007–2009 recession, total fertility rates have been persistently low. In response to that trend, CBO has adjusted its projection of fertility rates downward. CBO now expects total fertility rates to remain low for the next few years, gradually rising from a rate of 1.8 children per woman in 2019 to 1.9 children per woman by 2022, and then remaining at that rate. By contrast, CBO last year projected a total fertility rate of 1.9 children per woman in each year from 2018 through 2092.
CBO’s projection of net immigration is also lower than its projection last year. Between 2019 and 2092, the average net immigration rate is projected to be 3.1 immigrants per 1,000 people, compared with an average rate of 3.2 immigrants per 1,000 people over the same period in last year’s report. Those revisions are attributable to more recent data and to adjustments in the way CBO projects net immigration. CBO has lowered its near-term projection of net flows of foreign-born people without legal status on the basis of recent data that suggest net flows for that category are likely to be smaller over the next few years than previously anticipated. The agency also reassessed its approach for projecting the net flow of immigration in the second decade and now expects that the same economic forces driving immigration trends in the first decade of its projection will persist through the second decade, lowering the projected number of immigrants.8
In contrast, CBO has increased its projection of mortality rates in the near term and lowered the amount by which those rates improve over time. This year, CBO projects that life expectancy at birth will be 82.4 years in 2048, 0.4 years (or about 5 months) shorter than CBO projected last year, and life expectancy at age 65 is projected to be 21.5 years, 0.2 years (or about 2 months) shorter than in last year’s projections. Those changes stem from recent data showing higher mortality rates for people in all age groups, particularly those 45 or younger. Those higher-than-expected mortality rates are primarily being driven by increases in deaths from suicide, chronic liver disease, septicemia, and unintentional drug overdoses (from opioids in particular).9
Technical Changes
CBO made several small technical changes to its long-term projection methods. Some of those revisions worsened the projected actuarial balance and some improved it; on net, the revisions worsened the 75-year actuarial balance by 0.1 percent of GDP, or by 0.2 percent of taxable payroll, in CBO’s estimation.
Worsening the actuarial balance were changes that CBO made to its projections of spending for Social Security to match the agency’s most recently published 10-year projections.10 Those revised projections reflect updated data as well as downward revisions to wages and salaries throughout the projection period. Incorporating new tax data captured recent changes in the relationship between earnings and payroll taxes, which are projected to persist. The downward revisions to wages and salaries reflect updates to historical wage and salary data showing that their share of GDP was, on average, smaller over the past decade than previously reported. In addition, CBO incorporated more recent data—such as historical population data—from the Social Security trustees.11 Together, those changes worsened the actuarial balance by 0.1 percent of GDP, or by 0.3 percent of taxable payroll.
Partially offsetting those effects were updates to the historical data CBO used to create the representative sample, which improved the actuarial balance. That sample forms the basis of the main analytical tool that the agency uses to make long-term budget and economic projections. Those data include counts of the population by age and sex as well as counts of workers and beneficiaries. Together, those changes improved the projected actuarial balance by less than 0.05 percent of GDP, or by 0.1 percent of taxable payroll.12
Previously Important Factors That Did Not Change Significantly
Last year, CBO increased its projections of the share of earnings that is subject to the Social Security payroll tax, which improved the projected actuarial balance by less than 0.05 percent of GDP, or by 0.1 percent of taxable payroll. In this year’s projections, the share of earnings subject to the payroll tax is slightly higher, on average, than in last year’s projections. That change had a considerably smaller effect on the projected actuarial balance than the change last year.
How CBO’s Projections Compare With Those of the Social Security Trustees
Both CBO and the Social Security trustees project that, if current laws remained in place, Social Security spending would grow substantially in the coming decades as the population continues to age, outpacing growth in the program’s revenues.13 In both sets of projections, outlays increase faster than revenues at the end of the 75-year period.
The two sets of projections differ in their assessment of the size of the financial shortfall, however. The trustees’ projection of the 75-year actuarial balance is about −1.0 percent of GDP, representing a deficit that is about 0.5 percentage points smaller than the amount CBO projects. As a percentage of taxable payroll, the trustees’ projection of the 75-year actuarial balance is −2.8 percent, indicating a deficit that is 1.8 percentage points smaller than the amount CBO projects (see Table 2).
Table 2.
CBO’s and the Social Security Trustees’ Projections of the 75-Year Actuarial Balance

Sources: Congressional Budget Office; Social Security Trustees.
GDP = gross domestic product.
The 75-year projection period for the financial measures reported here begins in 2019 and ends in 2093. The projections incorporate the assumption that spending for Social Security continues as scheduled even if its trust funds are exhausted.
The actuarial balance is the sum of the present value of projected tax revenues and the current trust fund balance minus the sum of the present value of projected outlays and a year’s worth of benefits at the end of a given period, divided by the present value of GDP or taxable payroll. (A present value expresses a flow of past and future revenues or outlays as a single amount received or paid at a specific time. The value depends on the rate of interest, known as the discount rate, used to translate past and future cash flows into a single number.)
The difference between CBO’s projection of the actuarial balance and that of the trustees is largely explained by differences in projections of four major inputs into estimates of the system’s finances (see Figure 2):
Figure 2.
Differences Between CBO’s and the Social Security Trustees’ Projections of the Actuarial Balance
Percentage of Gross Domestic Product

Four major inputs account for four-fifths of the difference.
Sources: Congressional Budget Office; Social Security Trustees.
The projections incorporate the assumption that spending for Social Security continues as scheduled even if its trust funds are exhausted.
The actuarial balance is the sum of the present value of projected tax revenues and the current trust fund balance minus the sum of the present value of projected outlays and a year’s worth of benefits at the end of a given period, divided by the present value of GDP or taxable payroll. (A present value expresses a flow of past and future revenues or outlays as a single amount received or paid at a specific time. The value depends on the rate of interest, known as the discount rate, used to translate past and future cash flows into a single number.)
a. The key components of nominal GDP growth are the labor force participation rate, the unemployment rate, the rate of productivity growth, and the inflation rate.
b. Other differences include the differences in the projections of income taxes paid on Social Security benefits, the rates of disability insurance incidence, and interactions among the four major inputs, as well as differences that arise from the approaches that CBO and the trustees use, even when their major inputs are the same.
- The population;
- The key components of nominal GDP growth—the labor force participation rate, productivity growth, inflation, and the unemployment rate;
- Earnings subject to the Social Security payroll tax; and
- Real interest rates.14
Each of those inputs is subject to much uncertainty over the next 75 years.
To quantify the difference between the two sets of projections of the actuarial balance, CBO estimated how its projections of Social Security’s finances would change if it adopted the trustees’ projections for each input instead of using its own projections (see Table 3). If CBO adopted the trustees’ projections for those four major inputs—as well as their estimates of income taxes on benefits, rates of DI incidence, and interactions among the four major inputs—about 81 percent of the difference between CBO’s projections of the actuarial balance as a percentage of GDP and those of the trustees would be eliminated. The remaining 19 percent is attributable to differences between CBO’s and the trustees’ analytical approaches.
Table 3.
Differences Between CBO’s and the Social Security Trustees’ Projections of the 75-Year Actuarial Balance

Sources: Congressional Budget Office; Social Security Trustees.
DI = disability insurance; GDP = gross domestic product; * = between –0.005 and 0.005 percentage points; ** = between –0.5 and 0.5 percent; n.a. = not applicable.
The 75-year projection period for the financial measures reported here begins in 2019 and ends in 2093. These projections incorporate the assumption that spending for Social Security continues as scheduled even if its trust funds are exhausted.
The actuarial balance is the sum of the present value of projected tax revenues and the current trust fund balance minus the sum of the present value of projected outlays and a year’s worth of benefits at the end of a given period, divided by the present value of GDP or taxable payroll. (A present value expresses a flow of past and future revenues or outlays as a single amount received or paid at a specific time. The value depends on the rate of interest, known as the discount rate, used to translate past and future cash flows into a single number.)
a. The key components of nominal GDP growth are the labor force participation rate, the unemployment rate, the rate of productivity growth, and the inflation rate.
b. Other differences include the differences in the projections of income taxes paid on Social Security benefits, the rates of DI incidence, and interactions among the four major inputs.
Although this analysis focuses on differences in the projected actuarial balance, differences in annual revenues and outlays are also informative (see Figure 3). CBO’s projections of outlays as a percentage of GDP are higher than those of the trustees (by 5 percent in 2093, for example), and its projections of revenues as a percentage of GDP are lower than those of the trustees (by 7 percent in 2093). If CBO adopted the trustees’ projections for the four major inputs, the difference in projected revenues as a percentage of GDP would be largely eliminated, and the difference in projected outlays as a percentage of GDP would be mostly eliminated through about the mid-2060s. Beyond that point, CBO’s outlay projections would be higher than those of the trustees, by increasing amounts.
Figure 3.
CBO’s and the Social Security Trustees’ Projections of Social Security Tax Revenues and Outlays
Percentage of Gross Domestic Product

Sources: Congressional Budget Office; Social Security Trustees.
The projections incorporate the assumption that spending for Social Security continues as scheduled even if its trust funds are exhausted.
Tax revenues consist of payroll taxes and income taxes paid on benefits. Outlays consist of benefits and administrative costs, which typically account for less than 1 percent of the program’s costs.
The differences between CBO’s and the trustees’ projections of Social Security’s long-term finances are slightly larger now than they were last year. CBO’s 2019 projections of the Social Security system’s finances are slightly worse than it projected in 2018, whereas the trustees’ projections of the system’s finances are slightly better than last year’s. The difference between the two sets of projections of the actuarial balance as a share of taxable payroll has increased by about 0.2 percentage points from last year to this year; as a share of GDP, the difference has grown by less than 0.1 percentage point.
Size and Composition of the Population
The trustees expect that the ratio of working-age people to elderly people will be higher in the future than CBO does (see Figure 4). If CBO adopted the trustees’ projections of the population, then the actuarial balance would improve by 0.13 percent of GDP, accounting for 25 percent of the difference between the two sets of projections.
Figure 4.
CBO’s and the Social Security Trustees’ Projections of the Increase in Population in Different Age Groups
Percent

CBO projects a faster increase in the population age 65 or older and a slower increase in the 20–64 age group than the trustees do.
Sources: Congressional Budget Office; Social Security Trustees.
Social Security’s revenues largely depend on the number of people in the labor force, particularly adults between the ages of 20 and 64, and its outlays are closely linked to the number of people age 65 or older. The actuarial balance improves when a larger segment of the population pays into the trust funds that support Social Security and when a smaller portion receives benefits from the program.
The trustees project that the number of people between 20 and 64 will increase by 34 percent over the next 75 years, whereas CBO projects a 25 percent increase. Moreover, according to the trustees’ calculations, the number of people 65 or older is projected to increase by 107 percent between now and 2093, which is about 5 percentage points smaller than CBO’s projection.
CBO bases its population estimates on demographic projections that incorporate recent population data and estimates of future rates of fertility, net immigration, and mortality. The trustees project a slightly higher total fertility rate and a slightly slower decline in mortality rates than CBO does. For net immigration, the trustees’ projected rate initially exceeds CBO’s rate. Because the trustees project that net immigration will gradually decrease over the long term, however, their projection of the net immigration rate decreases over the 75-year period, whereas CBO’s projection of that rate increases slightly over the first 20 years and then remains flat for the remainder of the period.
Key Components of Growth in Nominal GDP
The size of the economy significantly affects Social Security’s revenues and spending. When nominal GDP is larger, Social Security’s revenues are immediately higher; later, when beneficiaries retire, Social Security’s outlays are higher. Greater nominal GDP improves Social Security’s actuarial balance because earlier years receive more weight in the calculation of that balance.
The trustees project faster average annual growth in nominal GDP than CBO does. If CBO adopted the trustees’ projections for rates of labor force participation, unemployment, and inflation, set the rate of productivity growth so that CBO’s projection of nominal GDP matched that of the trustees, and did not allow those changes to affect projections of other factors, then the actuarial balance would improve by 0.12 percent of GDP, accounting for 23 percent of the difference between the two sets of projections.15
In CBO’s projections, nominal GDP growth averages 3.9 percent over the 2019–2049 period. In the trustees’ projections, average annual growth in nominal GDP is faster—by almost 0.6 percentage points through 2029, by 0.4 percentage points over the subsequent two decades, and by 0.3 percentage points, on average, after 2049 (see Figure 5).16 The faster growth through 2049 is the result of several factors:
Figure 5.
CBO’s and the Social Security Trustees’ Projections of the Growth of Nominal Gross Domestic Product
Percent

Sources: Congressional Budget Office; Social Security Trustees.
Through 2049, CBO’s projections incorporate the adverse economic effects of rising federal debt and rising marginal tax rates. After that, they do not account for the effects of additional debt.
- The trustees project that the labor force participation rate will rise until 2023 before slowly declining; in CBO’s projection, that rate declines for several decades and then stabilizes in the early 2050s (see Figure 6). The decline is largely attributable to the ongoing aging of the population over the next 30 years.
Figure 6.
CBO’s and the Social Security Trustees’ Projections of the Labor Force Participation Rate
Percent
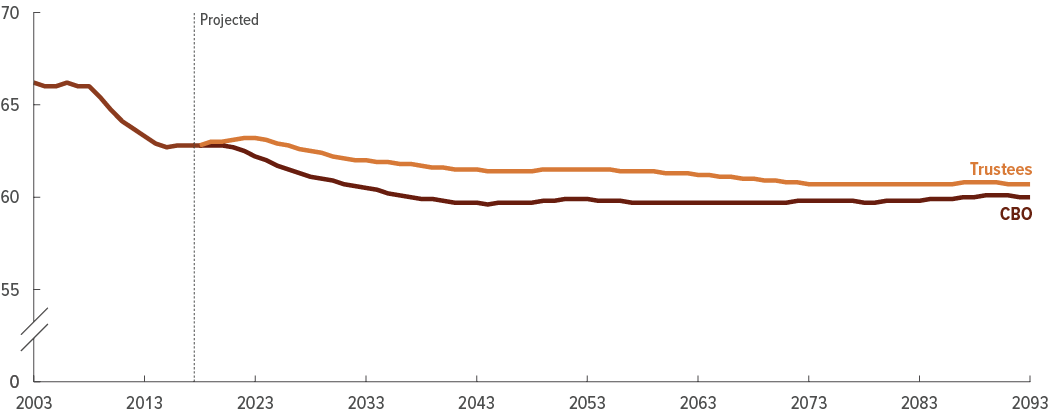
Sources: Congressional Budget Office; Social Security Trustees.
The labor force participation rate is the percentage of people in the civilian, noninstitutionalized population who are age 16 or older and are either working or actively seeking work.
- The trustees project stronger growth in labor productivity (the ratio of real GDP to hours worked) than CBO does for most years. The trustees project growth of 1.6 percent per year in the long run, whereas CBO projects an average increase of 1.5 percent. CBO’s projection of labor productivity is consistent with its projections of the growth in the labor force, capital services, and total factor productivity.
- The trustees project faster growth in prices than CBO does. In the trustees’ projections, the consumer price index for urban wage earners and clerical workers grows by 2.6 percent per year in 2021 and beyond; in CBO’s projection, that growth settles at 2.4 percent per year starting in 2029. In addition, the trustees’ projection of the annual inflation rate for all final goods and services produced in the economy, as measured by the rate of increase in the GDP price index, is higher than CBO’s projection. The trustees project that the GDP price index will increase annually by 2.25 percent, whereas CBO projects a 2.0 percent annual increase, which is the Federal Reserve’s long-run objective for inflation.
For the unemployment rate, the trustees’ projections are higher than CBO’s. The trustees project that the unemployment rate will stabilize at 5.5 percent beginning in 2023—a level notably higher than the average of 4.5 percent that CBO projects over the 75-year period. That higher unemployment rate in the trustees’ projections slightly offsets the other factors that raise nominal GDP relative to CBO’s estimates, because a higher unemployment rate means that a smaller portion of the labor force is employed.
As a result of the trustees’ projection of faster GDP growth, their projection of total economic output is 7 percent higher after a decade and 16 percent higher by 2049 than CBO’s projection of total economic output. By the end of the 75-year period, that difference doubles to 32 percent.
Earnings Subject to the Social Security Payroll Tax
The trustees’ estimates of earnings subject to the Social Security payroll tax, as a percentage of GDP, exceed CBO’s. In CBO’s projections, taxable earnings fall from 35.4 percent of GDP in 2018 to 35.2 percent by 2029 and to 31.6 percent by 2093. The trustees’ estimates rise to 36.3 percent of GDP in the late 2020s before falling to 34.6 percent by 2093. If CBO adopted the trustees’ projections of taxable earnings but did not allow those changes to affect projections of other factors, then its estimates of payroll tax receipts and, eventually, benefits paid would be higher.17 CBO’s resulting projection of the 75-year actuarial balance would improve by 0.11 percent of GDP, accounting for 21 percent of the difference between the two sets of projections.
Taxable earnings as a share of GDP depend largely on three factors: total compensation as a share of GDP, the share of total compensation that is paid as earnings, and the share of total earnings that is at or below the maximum taxable amount for Social Security ($132,900 in 2019). The amount of earnings subject to the Social Security payroll tax also depends to a lesser extent on the ratio of covered earnings to total earnings.
The trustees’ estimates of overall taxable earnings as a share of GDP are higher than CBO’s for three main reasons:
- Both the trustees and CBO project that the share of compensation paid as earnings will decline throughout the projection period. Between 2018 and 2050, earnings as a share of compensation are projected to decrease, on average, at roughly the same rate in both sets of projections, falling from 81.4 percent to 80.5 percent. Thereafter, the projections diverge: The trustees project that earnings as a share of compensation will decline at a slower rate than CBO projects, reaching 78.0 percent by 2093. In CBO’s projections, that measure drops below 76 percent by 2093.
- The trustees’ projections of compensation as a share of GDP rise more than CBO’s over the next decade—from 61.1 percent of GDP in 2017 to 63.2 percent in 2028—after which that share remains unchanged. In CBO’s projections, total compensation rises to 62.0 percent of GDP in 2028 and remains near that level in later years.
- The trustees estimate that the portion of earnings subject to the Social Security payroll tax will decline slightly from 82.8 percent in 2018 to 82.5 percent in 2027 and remain constant thereafter (see Figure 7). In CBO’s projections, that measure falls to 81.1 percent by 2029, continues to decline to 79.3 percent by 2049, and remains near that level thereafter. Over the past several decades, earnings have grown faster for high earners than for low earners. That pattern of unequal growth has caused a smaller share of earnings to be subject to the Social Security payroll tax over time. In CBO’s projections, that gap between the growth rate of earnings for workers with high earnings and those with lower earnings continues for the next 30 years and then stabilizes; the trustees’ projections, by contrast, suggest that the growth in earnings inequality will subside within the first decade.
Figure 7.
CBO’s and the Social Security Trustees’ Projections of the Share of Covered Earnings That Is Taxable for Social Security
Percent

Sources: Congressional Budget Office; Social Security Trustees.
Social Security payroll taxes are levied on covered earnings up to a maximum amount ($132,900 in 2019), which increases annually with the national average wage index except in years when there is no cost-of-living adjustment to benefits. Covered earnings are those received by workers in jobs subject to Social Security payroll taxes. The government collects payroll taxes on the earnings of most workers, although a small group of workers—mostly in state and local government or the clergy—are exempt. The taxable share of covered earnings affects revenues of the Social Security system as well as benefits paid in future years (because taxable earnings are used to calculate benefits).
Real Interest Rates
Interest rates affect measures of the system’s finances in two related ways. First, they determine the interest received on balances in the Social Security trust funds—and thus affect the year in which the trust funds are projected to be exhausted. Second, in the calculation of the actuarial balance, interest rates are used to compute the present values of future cash flows. Both CBO and the trustees use the average nominal interest rate on special-issue bonds held in the trust funds as the discount rate in calculating the actuarial balance.18 The real interest rate—that is, the nominal rate minus the inflation rate as measured by the consumer price index—is slightly lower in the trustees’ projections than in CBO’s through 2029 and higher thereafter. (The analysis in this section focuses on real interest rates because the effects of inflation were included in the analysis of the key components of nominal GDP growth.)
According to CBO’s calculations, the real rate in the trustees’ projections is 1.05 percent in 2019, increases from 0.19 percent in 2020 to 2.50 percent in 2034, and then remains at that level thereafter (see Figure 8).If CBO adopted the trustees’ projections of real interest rates but did not allow those changes to affect projections of other factors, because of those higher rates over the long term the actuarial balance would improve by 0.06 percent of GDP, accounting for 10 percent of the difference in the two sets of projections.19
Figure 8.
CBO’s and the Social Security Trustees’ Projections of the Real Interest Rate Used to Calculate the 75-Year Actuarial Balance
Percent

Sources: Congressional Budget Office; Social Security Trustees.
The actual and projected rates are the average real (inflation-adjusted) interest rates on all bonds held by the Social Security trust funds until they are exhausted. After the combined trust funds are projected to be exhausted, both CBO and the trustees use a discount rate based on the interest rate on new special-issue Treasury bonds, which CBO takes to equal the rate on 10-year Treasury notes.
The average real interest rate plus the rate of inflation as measured by the consumer price index equals the nominal interest rate used in the calculation of the actuarial balance. The actuarial balance is the sum of the present value of projected tax revenues and the current trust fund balance minus the sum of the present value of projected outlays and a year’s worth of benefits at the end of a given period, divided by the present value of gross domestic product or taxable payroll. (A present value expresses a flow of past and future revenues or outlays as a single amount received or paid at a specific time. The value depends on the rate of interest, known as the discount rate, used to translate past and future cash flows into a single number.)
Other Factors
Three additional factors affect CBO’s and the trustees’ projections: the rate of DI incidence, the income taxes paid on Social Security benefits, and interactions among the four major inputs. Those factors, on net, explain a small amount—3 percent—of the difference between the two sets of projections of the actuarial balance.
If CBO adopted the trustees’ projections for the rate of DI incidence, then the actuarial balance would worsen. For the first 30 years of their projections, the trustees have a higher rate of DI incidence than CBO does; for the remainder of the period, the trustees and CBO have the same age- and sex-adjusted rate of disability incidence (5.2 people per 1,000 insured workers).
If CBO adopted the trustees’ projections for the projected income taxes paid on Social Security benefits, then the actuarial balance would improve. The trustees’ projections of income taxes paid on Social Security benefits as a share of benefits are higher than CBO’s projections from 2020 through the early 2070s and then lower thereafter. Interactions among the four major inputs explain less than 0.005 percent of GDP of the difference between the two sets of projections.
On balance, if CBO adopted the trustees’ projections for the four major inputs discussed above and accounted for the effects of the other three factors, about 81 percent of the difference between CBO’s projection of the actuarial balance as a percentage of GDP and that of the trustees would be eliminated. The remaining 19 percent of the difference arises from the different approaches that the two sets of projections use, even when their major inputs are the same. For example, the main analytical tool CBO uses to make its long-term projections, the Congressional Budget Office Long-Term model (known as CBOLT), consists of four integrated components: a demographic model, a microsimulation model, a long-term budget model, and a macroeconomic growth model.20 The trustees use their own, different models.21
1. A present value expresses a flow of past and future revenues or outlays as a single amount received or paid at a specific time. The value depends on the rate of interest, known as the discount rate, used to translate past and future cash flows into a single number.
2. For the current projections and additional information, see Congressional Budget Office, The 2019 Long-Term Budget Outlook (June 2019), www.cbo.gov/publication/55331, and “CBO’s 2019 Long-Term Projections for Social Security: Additional Information” (September 2019), www.cbo.gov/publication/55590. For the 2018 projections and additional information, see Congressional Budget Office, The 2018 Long-Term Budget Outlook (June 2018), www.cbo.gov/publication/53919, and “CBO’s 2018 Long-Term Projections for Social Security: Additional Information” (September 2018), www.cbo.gov/publication/54428.
3. If the balance of the combined trust fund declined to zero and current revenues were insufficient to cover benefits specified in law, the Social Security Administration would no longer be permitted to pay full benefits when they were due. After trust fund exhaustion, annual outlays would be limited to annual revenues, and the trust fund’s balance would remain essentially at zero.
4. See Congressional Budget Office, The 2019 Long-Term Budget Outlook (June 2019), Appendix A, www.cbo.gov/publication/55331.
5. For additional details about CBO’s changes to its projections of the labor force participation rate, see Congressional Budget Office, The 2019 Long-Term Budget Outlook (June 2019), Appendix A, www.cbo.gov/publication/55331. For a discussion of CBO’s methods for projecting labor force participation, see Joshua Montes, CBO’s Projection of Labor Force Participation Rates, Working Paper 2018-04 (Congressional Budget Office, March 2018), www.cbo.gov/publication/53616.
6. The adjustment accounts for changes since 2000 in the share of people, by age and sex, who have worked long enough and recently enough to satisfy work requirements for disability benefits but are not yet receiving those benefits.
7. The total fertility rate is the average number of children that a woman would have if, in each year of her life, she experienced the birth rates observed or assumed for that year and if she survived her entire childbearing period. Mortality rates measure the number of deaths per 1,000 people in the population. The net immigration rate accounts for anyone who either enters or leaves the United States per 1,000 people in the population. For details about CBO’s projections of those factors, see Congressional Budget Office, The 2019 Long-Term Budget Outlook (June 2019), Appendix A, www.cbo.gov/publication/55331.
8. For additional details about CBO’s changes to its projections of net immigration, see Congressional Budget Office, The 2019 Long-Term Budget Outlook (June 2019), Appendix A, www.cbo.gov/publication/55331.
9. For an account of how factors affecting mortality and mortality improvement rates have changed over time, see National Center for Health Statistics, Health, United States, 2017: With Special Feature on Mortality, www.cdc.gov/nchs/data/hus/hus17.pdf (10.5 MB).
10. See Congressional Budget Office, Updated Budget Projections: 2019 to 2029 (May 2019), www.cbo.gov/publication/55151.
11. The most recent projections from the Social Security trustees that were available when CBO updated its projections are from Social Security Administration, The 2018 Annual Report of the Board of Trustees of the Federal Old-Age and Survivors Insurance and Federal Disability Insurance Trust Funds (June 2018), www.ssa.gov/oact/tr/2018.
12. See Congressional Budget Office, An Overview of CBOLT: The Congressional Budget Office Long-Term Model (April 2018), www.cbo.gov/publication/53667.
13. For details on the trustees’ latest projections, see Social Security Administration, The 2019 Annual Report of the Board of Trustees of the Federal Old-Age and Survivors Insurance and Federal Disability Insurance Trust Funds (April 2019), www.ssa.gov/oact/tr/2019.
14. For CBO’s previous analysis of differences between projections, see Congressional Budget Office, CBO’s Long-Term Social Security Projections: Changes Since 2017 and Comparisons With the Social Security Trustees’ Projections (December 2018), www.cbo.gov/publication/54711.
15. The analysis in this section includes the effects of higher inflation on nominal interest rates.
16. Through 2049, CBO’s projections incorporate the adverse economic effects of rising federal debt and rising marginal tax rates. After that, they do not account for the effects of additional debt.
17. Although adopting that projection would improve the outlook for Social Security’s finances, other aspects of the federal budget would be affected. For example, individual income tax receipts would decrease more than payroll tax receipts would increase because a smaller share of income would be subject to higher income tax rates.
18. After the combined trust funds are projected to be exhausted, both CBO and the trustees use a discount rate based on the interest rate on new special-issue Treasury bonds, which CBO takes to equal the rate on 10-year Treasury notes.
19. Higher interest rates are not favorable for the federal budget as a whole, however, because they raise the cost of federal borrowing and add to federal budget deficits.
20. For more information about how CBO makes long-term projections, see Congressional Budget Office, An Overview of CBOLT: The Congressional Budget Office Long-Term Model (April 2018), www.cbo.gov/publication/53667.
21. For more information about how the trustees make long-term projections, see Social Security Administration, Long-Range OASDI Projection Methodology: Intermediate Assumptions of the 2019 Trustees Report (April 2019), www.ssa.gov/OACT/TR/2019/2019_LR_Model_Documentation.pdf (PDF, 2.3 MB).
About This Document
This Congressional Budget Office report was prepared at the request of the Ranking Member of the Subcommittee on Social Security of the House Committee on Ways and Means. In keeping with CBO’s mandate to provide objective, impartial analysis, the report makes no recommendations.
Marina Miller (formerly of CBO) and Charles Pineles-Mark prepared the report with guidance from Julie Topoleski and David Weaver. Kevin Perese and Molly Dahl provided useful comments on various drafts of the report. Jimmy Chin fact-checked it.
Wendy Edelberg, Jeffrey Kling, and Robert Sunshine reviewed the report. Christine Bogusz was the editor, and Robert Rebach was the graphics editor. The report is available on CBO’s website (www.cbo.gov/publication/55914).
CBO continually seeks feedback to make its work as useful as possible. Please send any comments to communications@cbo.gov.

Phillip L. Swagel
Director
December 2019