
At a Glance
Over the past 10 years, the federal government’s net interest costs have grown by about 25 percent relative to the size of the economy as represented by gross domestic product (GDP). Historically low interest rates have held down that growth, compared with growth in debt held by the public. Over the same period, that debt has increased by nearly 65 percent relative to GDP.
In this report, the Congressional Budget Office describes federal net interest outlays and their projected growth over the coming decade:
- Components of Net Interest. In the federal budget, the category of spending called net interest comprises the government’s interest payments on debt held by the public, offset by certain types of interest income that the government receives. Some of those payments and receipts are intragovernmental transactions on accounts that are not related to the public debt and have no effect on the overall federal budget.
- Net Interest Outlays. Net outlays for interest largely depend on interest rates and the amount of debt that the Treasury issues to the public. In fiscal year 2020, net outlays for interest totaled $345 billion, equal to 1.6 percent of GDP and 5.3 percent of total federal spending.
- Growth of Net Interest Outlays. In CBO’s most recent projections, the cumulative deficit from 2021 through 2030 totals nearly $13 trillion. Borrowing to finance that deficit—at a time when interest rates are expected to rise—would cause net interest payments as a percentage of GDP to increase over that period, from 1.4 percent to 2.2 percent, which is generally in line with the 50-year average of 2.0 percent. Over the long term, interest rates are projected to rise further, and the amount of debt issued is projected to grow, causing net outlays for interest to increase to about 8 percent of GDP by 2050.
Notes
Notes
Unless this report indicates otherwise, all years referred to are federal fiscal years, which run from October 1 to September 30 and are designated by the calendar year in which they end.
Numbers in the text and tables may not add up to totals because of rounding.
Budgetary amounts are presented in nominal dollars and are compared with nominal gross domestic product.
The projections in this report are from Congressional Budget Office, An Update to the Budget Outlook: 2020 to 2030 (September 2020), www.cbo.gov/publication/56517.
Summary
In fiscal year 2020, the government’s net outlays for interest totaled $345 billion, equal to 1.6 percent of gross domestic product (GDP) and accounting for 5.3 percent of total spending. The interest the government pays on debt held by the public has remained low as a percentage of GDP, even though that debt has risen to historically high levels. Interest costs are projected to grow steadily as interest rates rise and the size of the debt increases. Although the federal government has increased its borrowing from the public by $12 trillion (or roughly 130 percent) in the past 10 years, net annual outlays for interest rose by $149 billion (or roughly 75 percent) because interest rates fell to historically low levels.
What Is Net Interest?
The government pays and collects interest in various ways. Net interest consists of the interest it pays minus the interest it receives. The outlays largely reflect the interest paid to holders of the debt that the Treasury issues to the public. Although the Treasury also issues debt to trust funds and other government accounts, the payment of interest to those accounts is an intragovernmental transaction that has no effect on the budget deficit.
The net interest costs shown in the budget include interest paid on all Treasury securities ($523 billion in 2020), minus the portion of that interest that is received by trust funds ($135 billion in 2020) and the net amount of other interest and investment income received by the government ($43 billion in 2020). The last category consists primarily of net receipts to the Treasury from the financing accounts that track the cash flows of federal credit programs (mostly student loans).
The federal government’s interest payments depend largely on interest rates and the amount of debt held by the public. Other factors, such as the rate of inflation and the maturity structure of outstanding securities, also affect interest costs. (For example, long-term bonds generally carry higher interest rates than do short-term bills.) Interest rates are determined by market forces, such as the supply and demand for Treasury securities, and the policies of the Federal Reserve.
What Are CBO’s Projections of Net Interest?
In the Congressional Budget Office’s most recent projections, which incorporate the assumption that current laws governing revenues and spending generally remain the same, the cumulative deficit from 2021 through 2030 totals nearly $13 trillion. Borrowing to finance that deficit—at a time when interest rates are expected to rise—would cause net interest outlays to more than double over the next 10 years, from an estimated $290 billion in 2021 to $664 billion in 2030. As a percentage of GDP, those outlays would increase from 1.4 percent to 2.2 percent over the period. For the majority of those 10 years in CBO’s forecast, interest rates remain historically low despite the rise in public debt.
Chapter 1 Net Interest in the Federal Budget
The federal government pays and collects interest in various ways; its net outlays for interest equal the interest it pays minus the interest it receives. Those net outlays primarily comprise the interest paid to holders of the debt that the Department of the Treasury issues to the public. The Treasury also issues debt to trust funds and other government accounts, but the payment of interest to those accounts is an intragovernmental transaction that has no effect on net interest costs or the budget deficit. Other federal accounts also pay and receive interest for a variety of reasons.
The federal government’s net interest costs largely depend on interest rates and the amount of debt held by the public, which generally consists of bills, notes, bonds, and inflation-protected securities.1 Other factors, such as the rate of inflation (to which some debt is indexed) and the maturity structure of outstanding securities, also affect interest costs; for example, long-term bonds generally carry higher interest rates than do short-term bills. Interest rates are determined by a combination of market forces, including the supply of Treasury securities, the demand for fixed-income investments, and the policies of the Federal Reserve System.
Debt held by the public is determined largely by cumulative budget deficits, which depend on policy choices about spending and revenues, economic conditions, and other factors. The maturity structure of the debt is determined by the borrowing policies of the Treasury, which issues a variety of short- and long-term debt securities.
The Effects of Declining Interest Rates
Interest rates on Treasury securities have fallen to historically low levels, allowing net outlays for interest to remain low relative to gross domestic product even as debt held by the public has surged in the past few years to its highest level relative to GDP since the 1940s.2 For example, rates on 3-month Treasury bills declined from an average of almost 5 percent in 2007 to a low of just 0.03 percent in 2015; those rates averaged 0.7 percent in fiscal year 2020. Similarly, rates on 10-year Treasury notes have dropped from an average of close to 5 percent in 2007 to an unprecedented low of 1.1 percent in 2020. (See Box 1-1 for information about negative interest rates.) As a result, despite the dramatic increase in debt held by the public—from 35 percent of GDP at the end of 2007 to 100 percent at the end of 2020—net interest as a percentage of GDP fell from 1.7 percent in 2007 to 1.2 percent in 2015 before rising to 1.8 percent in 2019 (see Figure 1-1). Although the debt increased significantly in 2020, net interest outlays declined both in dollars and as a percentage of GDP last year.
Box 1-1.
Negative Interest Rates
The Treasury regularly auctions its bills, notes, and bonds, as well as Treasury inflation-protected securities (TIPS). Competitive bids are submitted mostly by large financial institutions for their own accounts or on behalf of customers in the resale market. The bids specify the amount each investor would pay for the security. The Treasury sorts the bids in ascending order of the discount rate (for Treasury bills) or yield (for notes and bonds) it will accept, until the quantity of accepted bids reaches the amount of securities available for sale. Successful bidders are awarded securities at the highest accepted discount rate or yield.
Can Rates on Treasury Securities Be Negative?
Under typical circumstances, an investor who purchases a Treasury security—effectively lending money to the U.S. government for a fixed period of time—requires compensation for that action, even if the loan may be considered free of default risk. That compensation reflects the time value of money—the fact that a dollar today is worth more than a dollar at some future date because it can earn interest or be put to other uses in the interim.
During periods of extreme financial stress, however, the demand for risk-free securities such as Treasury bills can outweigh the time value of money. In that scenario, investors may be willing to pay more today than they will receive at a future date, thereby earning a negative interest.
In addition to such a flight toward safety, yields on Treasury securities could turn negative for other reasons, including regulatory requirements (for example, on financial institutions or pension funds), expectations of deflation (a decrease in purchasing power), or speculation that rates will fall even further (and provide an opportunity to sell at a profit).
Short-term Treasury rates tend to closely approach the federal funds rate set by the Federal Open Market Committee of the Federal Reserve. In recent statements, the committee reiterated its policy that negative interest rates are not an attractive monetary policy because they may damage banks’ profitability and reduce the willingness of banks to lend.
Have Interest Rates Been Negative Before?
It is the Treasury’s policy not to sell securities at a negative yield. (However, on the secondary trading market as recently as March 2020, bills have traded at prices higher than their par, or resale, value, which is equivalent to a negative interest rate.) The only exception to that policy is for TIPS, which have a face value that rises with inflation; therefore, a periodic cash payment is only a piece of the overall compensation paid to investors. In October 2010, the Treasury sold $10 billion in 5-year TIPS with a par value of $100 for $105.51, marking the first occurrence of a security auctioned with a negative yield to maturity. Over the past year, TIPS have routinely sold at auction at prices higher than their par value.
Although rare in the United States, even in secondary markets, negative interest rates are far more common in international markets. Negative yields, even on long-term debt, have been common in Japan since 2006. Similarly, countries throughout Europe, including France, Germany, Italy, and the United Kingdom, have seen yields on various securities turn negative.
Figure 1-1.
Net Interest Outlays, Debt, and Interest Rates, 1970 to 2020

Since 2007, net interest outlays have generally remained steady relative to gross domestic product . . .
. . . despite rapid growth in debt held by the public . . .
. . . because interest rates have declined over time.
Data source: Congressional Budget Office. See www.cbo.gov/publication/56780#data.
The decline in interest rates, even during an era of rapid debt expansion, can be attributed to several factors.3 One explanation for the decline is a slowdown in the growth of economic output. An increase in productivity drives demand for capital investment; however, when economic growth begins to slow, the potential gains for risky investments also decrease, and more capital flows to Treasury securities. Another reason for the downward trend in interest rates is the increased demand for less-risky assets such as Treasury securities in the wake of the global financial crisis and the recession brought on by the 2020 coronavirus pandemic. That increased demand has contributed to the decline in yields on Treasury securities. Other explanations include the slowdown in labor force participation, increased saving among emerging market economies, the aging of the population, and greater income inequality, which has contributed to increased saving.
Net Interest Outlays
Net interest outlays as a percentage of GDP have fluctuated over the past 50 years, from a low of 1.2 percent to a high of 3.2 percent. Through most of the 1970s, outlays totaled no more than 1.5 percent of GDP. At the end of that decade, however, the growing amount of debt and higher interest rates began to boost interest costs; by 1985, net interest as a percentage of GDP exceeded 3.0 percent, twice its level in the mid-1970s. For the following decade, net interest costs remained at about 3 percent of GDP, but smaller budget deficits (and a brief period of surpluses) coupled with lower interest rates for many securities pushed those costs down in the late 1990s. Net interest continued to decline as a percentage of GDP in the early 2000s, going below 2.0 percent, where it has since remained.
Gross Interest on Treasury Securities
The largest component of net interest outlays is the interest paid to holders of public debt, or gross interest. Over the past 10 years, the nominal amount of that debt has more than doubled, rising from $9.0 trillion to $21.0 trillion. However, a decline in interest rates over the same period limited the growth in gross interest outlays, which grew by only 26 percent, from $414 billion in 2010 to $523 billion in 2020.
Interest Received by Trust Funds
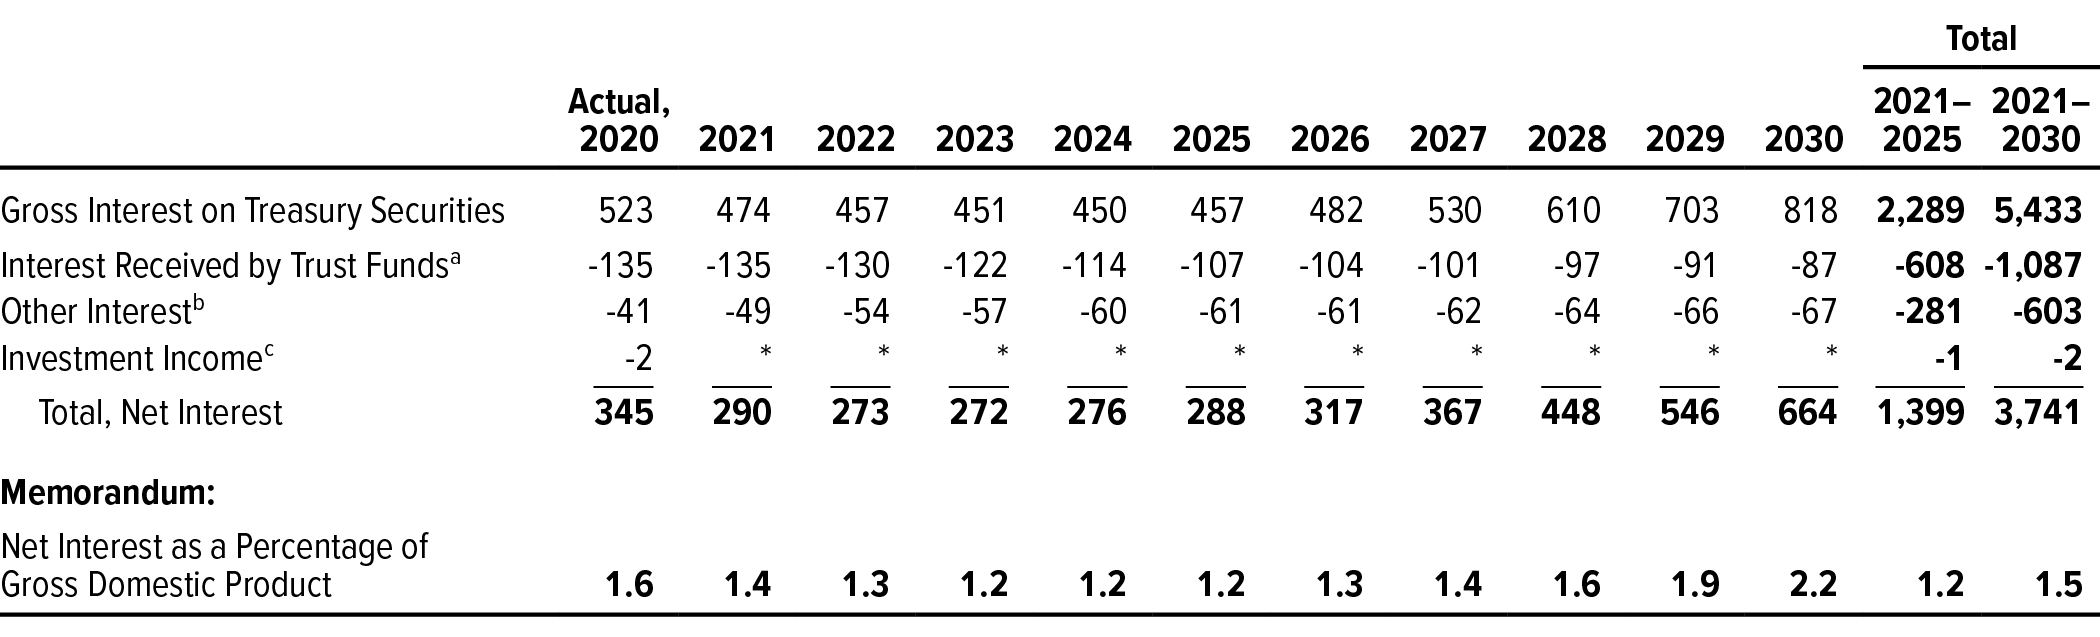
Federal trust funds and other government accounts hold about $5.9 trillion in Treasury securities. Nearly 90 percent of that total is held by trust funds, such as those for Social Security and for the pensions of retired military and civilian federal workers. Similar in composition to debt held by the public, the securities held by trust funds and other government accounts consist of bills, notes, bonds, and inflation-protected securities. However, the interest paid on those securities has no net effect on interest outlays because both the payments and the receipts are recorded in the same category of spending in the federal budget. The payments are part of gross interest paid on Treasury securities, and the receipts appear separately in the net interest category. In 2020, trust funds were credited with $135 billion of such intragovernmental interest, mostly for the Social Security trust funds and the retirement trust funds for civil servants and military personnel (see Table 1-1).
Table 1-1.
Net Interest Outlays
Billions of Dollars

Data sources: Congressional Budget Office; Office of Management and Budget.
Negative numbers represent the government’s interest income; positive numbers represent its interest expense.
* = between -$500 million and $500 million.
a. Mainly the Social Security, Civil Service Retirement, Military Retirement, Medicare, and Unemployment Insurance trust funds.
b. Primarily interest from the financing accounts for federal credit programs.
c. Earnings on private investments by the National Railroad Retirement Investment Trust.
Other Components of Net Interest
Although the federal government’s net interest outlays are mainly for interest on the Treasury’s borrowing from the public and the trust funds, the government also pays and receives interest from other transactions. The federal budget includes dozens of accounts that reflect those interest payments and collections. (Collections of interest are shown in the budget as negative outlays—that is, as offsets to spending.) All told, those accounts were credited with net collections of $43 billion in 2020. Some of those accounts have no net effect on the budget because they involve intragovernmental transactions and reflect payments or receipts from other federal budget accounts.
Interest Receipts
Overall, the government receives more interest in the “other interest” category than it pays out, primarily because of interest received from specialized financing accounts, which track the cash flows of credit programs. (The largest of those accounts finances the federal student loan programs.) Over the past 10 years, net receipts by accounts in that category have averaged $38 billion (see Table 1-2).
Table 1-2.
Other Interest
Billions of Dollars

Data sources: Congressional Budget Office; Office of Management and Budget.
Negative numbers represent the government’s interest income; positive numbers represent its interest expense.
MERCHF = Department of Defense Medicare-Eligible Retiree Health Care Fund (including TRICARE for Life); USPS = Postal Service; * = between -$500 million and zero.
a. Includes small amounts of receipts, outlays, and intragovernmental payments that could not readily be categorized.
Credit Financing Accounts. Under the Federal Credit Reform Act of 1990, the budget shows the subsidy costs of the government’s direct loans and loan guarantees rather than the cash flows associated with those activities. The subsidy cost is the discounted present value of all future cash flows: generally, disbursements and repayments net of default losses in the case of direct loans; and fees, payments for defaults, and recoveries in the case of loan guarantees.4
To track those cash flows and reconcile them with subsidy costs that are recorded in the budget, the Treasury created credit financing accounts. Although the cash flows of credit financing accounts are not included in the budget totals, they influence the Treasury’s borrowing requirements.
For a direct loan made by the government, a financing account receives a subsidy payment from the budget account for that loan program (recorded in the budget as an outlay) and borrows from the Treasury the rest of the funds needed to make the loan. Some or all (or more than all when the interest payments exceed the defaults) of that borrowing by the financing account is repaid to the Treasury over time as the direct loan made by the government is repaid. Meanwhile, the financing account pays interest to the Treasury on any outstanding balance. Those interest receipts are recorded in the budget as negative outlays (see Figure 1-2).
Figure 1-2.
The Budgetary Treatment of Federal Credit Programs With Positive Subsidy Costs

Data source: Congressional Budget Office.
For each program, credit reform accounting requires two accounts: a program account and a financing account. (In addition, if the subsidy is negative, an on-budget receipt account is necessary.) The program account shows the net subsidy costs, and the financing account reflects the cash flows that make up those subsidy costs.
The cash flows between the financing account and originators of guaranteed loans (and securities) or borrowers of direct loans are a means of financing the deficit and are excluded from the calculation of the budget deficit—that is, they are “below-the-line” accounts.
If the credit program has a positive subsidy, the program account makes a single payment to the financing account for each credit cohort. (If the credit program has a negative subsidy, the financing account makes a payment to a receipt account in the Treasury.)
The annual interest payments between the Treasury and the financing account can also flow in either direction. If the financing account has been a net borrower, it pays interest to the Treasury. If the financing account holds government securities, then the Treasury makes interest payments to the financing account.
Therefore, direct loans result in three different interest flows:
- Borrowers pay interest on their loans, which is credited to the financing account;
- The financing account, in turn, pays interest to the Treasury on the money it borrowed to make the loans; and
- The Treasury pays interest on the public debt that it issued to provide the necessary resources for the financing account.
The first of those three flows is not counted in the budget; the other two are.
Loan guarantees operate differently. With a guarantee, the government agrees to repay, in the event of default, loans made by nongovernmental institutions. Financing accounts for guaranteed loan programs usually receive cash inflows when a loan is made, and the inflows often include guarantee fees from lenders and subsidy payments from the budget account for that loan program. Any defaults on loans that would require a payment from the account typically occur later. As a result, a financing account for a guarantee program generally runs a surplus, and it loans that surplus to the Treasury, which credits the financing account with interest payments. In fiscal year 2020, on net, financing accounts paid $32 billion to the Treasury.
Unemployment Loans to States. When states have insufficient funds in their Unemployment Trust Fund accounts, they may receive advances from the federal government to pay unemployment benefits. States pay no interest on those advances if they repay them within a fiscal year, but after that they generally are charged interest (see Box 1-2 for more detail). At the end of September 2020, balances on the unemployment loans to states totaled $39.5 billion, but in fiscal year 2020, states did not pay interest to the Treasury on such loans.5
Box 1-2.
The Unemployment Trust Fund
The unemployment insurance (UI) system is a partnership between the federal government and the states that provides payments to eligible workers who have been laid off. The system uses tax receipts received by states and the federal government to pay benefits and administrative expenses. Those transactions take place within the Unemployment Trust Fund (UTF), an accounting mechanism that the government uses to link revenues and expenditures of the UI system. The various transactions of the trust fund can generate interest income as well as interest outlays for the federal budget.
Funding for unemployment insurance is ordinarily drawn from payroll taxes imposed on employers by both state governments and the federal government. All funds collected through UI payroll taxes are deposited in accounts in the UTF. (The trust fund includes an account for each state, along with several federal accounts.) During times of economic growth and low unemployment, revenues credited to the federal and state accounts are higher than expenditures from those accounts, causing balances to grow. Under federal law, the trust fund invests those balances in Treasury securities, thereby earning interest that is credited to the fund. That interest is intragovernmental and therefore has no effect on net interest outlays or the federal budget.
During economic recessions and periods of high unemployment, states can draw down their accounts in the trust fund when their UI expenditures exceed tax receipts, thereby reducing investment in federal securities. If a state does not have enough reserves in its account to pay all benefits owed, the state may get an advance from a federal account in the trust fund or borrow money from outside sources. (By law, a state must continue to pay unemployment benefits even if its reserve is depleted.) If the advance to the state account is paid back within a specified time and the state meets a few other requirements, it is not required to pay interest on those advances.1 Generally, if the state does not meet the specified criteria, it is required to pay interest (at the same rate it would have received on any balances held in its account on December 31 of the preceding year). State revenues generated from payroll taxes may not be used to pay the interest charges.
Repayment of accrued interest would reduce total net interest outlays in the federal budget. The Families First Coronavirus Response Act, enacted on March 18, 2020, temporarily waived interest payments and suspended the accrual of interest on federal advances to states to pay unemployment compensation benefits through December 2020. Thus, no interest was due in 2020.
If the federal account responsible for providing advances to states itself becomes depleted, then it may borrow from the general fund of the Treasury (after first borrowing from the other federal accounts in the UTF).2 That federal account in the UTF would immediately accrue interest costs for any funds borrowed. The interest rate charged would equal the average rate of interest (as of the end of the preceding month) borne by all interest-bearing obligations forming part of the public debt. The same is true for the federal account that pays for extended unemployment compensation benefits.
1. See Congressional Research Service, The Unemployment Trust Fund (UTF): State Insolvency and Federal Loans to States (December 2020), https://crsreports.congress.gov/product/pdf/RS/RS22954.
2. See Congressional Budget Office, The Outlook for Major Federal Trust Funds: 2020 to 2030 (September 2020), www.cbo.gov/publication/56523.
Interest Outlays
The federal government also makes interest payments to individuals and other entities. Such interest outlays have averaged $4 billion over the past 10 years.
Tax Refunds. The Treasury pays interest on individual, corporate, and excise tax refunds that are paid more than 45 days after the filing date. Interest on such refunds is mainly interest on income tax returns that have been amended or audited. Corporate and individual taxpayers can file an amended return for a previous year; if a refund is due, the Internal Revenue Service calculates interest from the initial filing date. Over the past 10 years, those payments have averaged about $2 billion a year.
Resolution Funding Corporation. The Resolution Funding Corporation (REFCORP) is a government-sponsored enterprise created in 1989 to provide initial funding for the Resolution Trust Corporation. REFCORP issued $31.2 billion in bonds to finance the trust’s efforts to resolve the savings and loan crisis in the late 1980s and early 1990s. Interest owed by the Treasury on those obligations totaled $2.6 billion annually from 2016 through 2019 and has declined since then as bonds matured. Payments in 2020 amounted to $2.4 billion. All REFCORP bonds mature by April 2030, at which point interest payments will cease.
Intragovernmental Interest
Some accounts in the “other interest” category have no net effect on the budget because they involve intragovernmental payments and reflect receipts from other federal budget accounts.6 Such accounts include the retiree health care funds for certain members of the military and employees of the Postal Service (USPS), the Nuclear Waste Fund, and some other federal entities.
Medicare-Eligible Retiree Health Care Fund. Established by the National Defense Authorization Act for Fiscal Year 2001, the fund began operation in 2003. It pays for the supplemental health care benefits of retirees of the uniformed services and their dependents and survivors, once the retirees are eligible for Medicare. The Treasury makes accrual payments into the fund for future benefits and also pays interest on the balance of the fund. In 2020, the Treasury’s interest payments to the fund totaled $8 billion.
Federal Financing Bank. The Federal Financing Bank (FFB) is an arm of the Treasury Department that acts as a financial intermediary for a few federal agencies, government corporations, and government-sponsored enterprises. The FFB was created in 1973 to reduce federal borrowing costs and improve debt management by assisting with and coordinating borrowing by federal agencies. It borrows directly from the Treasury and charges the agencies its own cost of borrowing plus one-eighth of 1 percentage point. Payments of interest from the FFB to the Treasury have been about $2 billion annually in recent years, mostly resulting from loans to the Department of Energy’s Advanced Technology Vehicles Manufacturing loan program and the Rural Utilities Service. Those interest payments have no net effect on the budget; they appear as outlays in the FFB’s budget account and as receipts in “other interest.” As of September 30, 2020, the FFB’s portfolio totaled $81 billion.
Postal Service Retiree Health Benefits Fund. This fund was established in 2006 to finance the health benefits of USPS retirees beginning in 2017. As of September 30, 2020, the fund had a balance of roughly $45 billion, and its interest earnings in 2020 totaled about $1 billion.7
Nuclear Waste Fund. This fund pays for activities related to the permanent disposal of high-level nuclear waste from commercial and defense-related sources. Its income, which it receives from fees paid by commercial producers of nuclear power, is invested in long-term Treasury securities. The interest credited to the fund totaled about $2 billion in 2020 and, in CBO’s projections, averages about the same amount annually over the 2021–2030 period.
Other Interest Outlays and Receipts
The Congress allows certain government corporations and federal entities to borrow from the Treasury to finance part of the costs of their programs. That borrowing authority is conferred through either permanent authorizing language or annual appropriations. The Treasury and the individual agencies decide on the terms of the loan, depending on the needs of the program being financed. The agencies’ borrowing includes both long- and short-term debt, and interest rates vary by program.
For those intragovernmental transactions, the interest payment is recorded as an outlay for the participating agency, and the receipt of that payment is recorded as an offsetting receipt in the Treasury’s intragovernmental interest account. Interest on loans to the Bonneville Power Administration, the National Flood Insurance Fund, and the Helium Fund accounted for almost all of the $1 billion in other intragovernmental receipts in 2020.
Other accounts in the other interest category record inflows to the government from interest payments or earnings on investments; such collections are recorded as negative outlays in the budget.
Investment Income
The National Railroad Retirement Investment Trust (NRRIT), a tax-exempt entity that is independent of the federal government, is charged with managing and investing the assets of the Railroad Retirement program. The trust’s functions are considered federal, however, so the budget accounts for its earnings and losses in the category of net interest.
NRRIT is authorized to invest the assets of the Railroad Retirement fund in a diversified investment portfolio, like the portfolios of private-sector retirement plans. About 95 percent of the current portfolio is invested in private holdings that the trust actively manages; the remaining 5 percent is invested in nonmarketable Treasury securities. Market volatility can produce large swings in earnings from NRRIT’s investments, but from 2010 through 2020—a decade of steady market growth—the trust’s average earnings totaled about $2 billion a year, ranging from a gain of $4 billion in 2012 to a small loss in 2015 (see Table 1-1). At the end of 2020, the balance of nonfederal securities in the Railroad Retirement fund was about $24 billion.
Budgetary Treatment
Two different accounting measures—cash accounting and accrual accounting—are used to record the net costs of federal activities in the federal budget.8 The principal difference between them lies in the timing of when the commitment (or collection) of budgetary resources is recognized. Transactions using cash accounting are recorded when payments are actually made or receipts collected, whereas accrual measures record the expenses and related receipts when the legal obligation is first made rather than when subsequent cash transactions occur. The federal government’s interest costs are recorded monthly, on an accrual basis, rather than when the payments are made.
For example, the Treasury does not make periodic cash payments to holders of Treasury bills; instead, it issues the bills at a discount to their final redemption value. Although no cash is exchanged between the purchase date and the maturity date, the Treasury calculates the incremental increase in value each month as the bill approaches the redemption value, and it records that increase as an interest outlay.
For other securities—notably, notes and bonds—the Treasury makes interest payments to investors, typically once every six months. For such “coupon” securities, the Treasury calculates the monthly interest due and records an interest outlay even in months when no actual payments are made.
For Treasury inflation-protected securities (TIPS), the interest rate is fixed and determined at auction, but the periodic cash payments vary because the rate is applied to the inflation-adjusted principal.9 Interest outlays for the principal adjustment and the fractional coupon payment are also recorded monthly.
1. Treasury bills, which mature in less than 1 year, are sold at a discount. Treasury notes and bonds are coupon securities (which pay out cash periodically) that mature in 2 to 10 years and 20 to 30 years, respectively. Inflation-protected securities differ in that their principal amounts are adjusted to account for inflation. For more information on Treasury securities and their defining properties, see Congressional Budget Office, Federal Debt: A Primer (March 2020), www.cbo.gov/publication/56165.
2. Fiscal year 2020 saw a debt increase of more than $3.3 trillion—the largest in history by a wide margin. However, the resulting interest outlays were constrained because of historically low interest rates. The overall rate in 2020 reflects the average over the entire fiscal year, including many months before the market’s reaction to the 2020 coronavirus pandemic caused rates to decline to about 0.5 percent.
3. See Edward N. Gamber, The Historical Decline in Real Interest Rates and Its Implications for CBO’s Projections, Working Paper 2020-09 (Congressional Budget Office, forthcoming).
4. A present value is a single number that expresses a flow of current and future payments in terms of an equivalent lump sum received or paid at a specific time. See Congressional Budget Office, Estimates of the Cost of Federal Credit Programs in 2021 (April 2020), www.cbo.gov/publication/56285.
5. The Families First Coronavirus Response Act (Public Law 116-127) suspended collection of interest on those loans through the end of the 2020 calendar year.
6. Interest payments to the Federal Reserve, which holds 21 percent of all outstanding Treasury securities, are not considered intragovernmental and are recorded as interest outlays on publicly held debt. However, the Federal Reserve remits profits, mostly from interest payments it collects, back to the Treasury; those profits are recorded in the federal budget as revenues.
7. The Postal Service Retiree Health Benefits Fund is distinct from the Civil Service Retirement Trust Fund, which makes the benefit payments for most retired federal employees, including former postal workers.
8. Cash accounting is far more common and is used for the majority of federal programs. See Congressional Budget Office, Cash and Accrual Measures in Federal Budgeting (January 2018), www.cbo.gov/publication/53461.
9. The inflation adjustment is based on the consumer price index for all urban consumers (not seasonally adjusted). The adjustment to the value of outstanding TIPS is made daily but is not paid until maturity. For more information, see TreasuryDirect, “TIPS in Depth” (accessed December 9, 2020), https://go.usa.gov/xEusU.
Chapter 2 Net Interest in CBO’s Projections
In the Congressional Budget Office’s September 2020 baseline budget projections, which reflect the assumption that current laws governing taxes and spending generally remain unchanged, the federal deficit grows in coming years. As a result, the nation’s debt rises significantly, both in dollars and as a percentage of gross domestic product.
In addition, CBO projects that under current law, interest rates would dip in 2021 and then generally increase in the coming decade. Because of the rising debt and rising rates, the government’s net interest costs in 2030 would total $664 billion, equal to 2.2 percent of GDP and about 9 percent of total federal outlays. (The historical highs for those amounts were 3.2 percent of GDP in 1991 and 15.4 percent of total federal outlays in 1996.)
Net Interest Outlays
In CBO’s projections, increases in debt and interest rates substantially boost the cost of interest on the government’s debt.1 Debt held by the public increases to 109 percent of GDP in 2030, and interest rates climb from their current levels.
CBO expects interest rates to rise as the economy recovers and then continues to expand, particularly in the latter half of the coming decade. The rate on 3-month Treasury bills is forecast to remain near 0.2 percent through 2026 and then increase to 2.0 percent in 2030 (see Figure 2-1). The rate on 10-year Treasury notes is expected to rise steadily, from an average of 1.1 percent in 2020 to 3.1 percent in 2030. The agency expects the interest rate on 10-year Treasury notes to average 1.3 percent over the 2020–2025 period and 2.7 percent over the 2026–2030 period.
Figure 2-1.
CBO’s Projections of Net Interest Outlays, Debt, and Interest Rates, 2020 to 2030

In CBO’s baseline, net outlays for interest relative to gross domestic product remain below the 2020 level until 2028 . . .
. . . and then rise, in part, because of higher debt stemming from increased borrowing . . .
. . . and because of higher interest rates.
Data source: Congressional Budget Office. See www.cbo.gov/publication/56780#data.
In CBO’s projections, net interest outlays decline from 1.6 percent of GDP in 2020 to 1.4 percent in 2021 and, despite rising debt and interest rates, remain below the 2020 level until 2029. The lag between rising debt and interest rates and their effect on interest outlays occurs because Treasury securities have fixed interest costs over their lifetime, and therefore outlays do not rise at the same pace as rates. A rise in interest rates affects only outlays for securities that are issued after the increase occurs.
Net outlays for interest decline from $290 billion in 2021 to $272 billion in 2023 before rising to $664 billion in 2030 in CBO’s projections (see Table 2-1). At that point, they would account for about 9 percent of federal spending. Much of that growth occurs at the end of the period; outlays remain below their 2020 total until 2027.
Table 2-1.
CBO’s Baseline Projections of Net Interest Outlays
Billions of Dollars
Data source: Congressional Budget Office.
Negative numbers represent the government’s interest income; positive numbers represent its interest expense.
* = between -$500 million and zero.
a. Mainly the Social Security, Civil Service Retirement, Military Retirement, Medicare, and Unemployment Insurance trust funds.
b. Primarily interest from the financing accounts for federal credit programs.
c. Earnings on private investments by the National Railroad Retirement Investment Trust.
Gross Interest on Treasury Securities
The increase in net interest outlays in CBO’s baseline is driven primarily by the growth in gross interest on Treasury securities. Those outlays generally follow the pattern of interest rates in CBO’s economic projections, initially declining as debt matures and is reissued at lower rates and then rising in the second half of the coming decade as projected interest rates rise and debt accrues. Gross interest outlays are projected to decline from $474 billion in 2021 to $450 billion in 2024 before rising to more than $800 billion in 2030, totaling $5.4 trillion over the decade. Over that same period, the average interest rate on public debt is projected to decrease from 1.5 percent in 2021 to 1.2 percent in 2024 before rising to 2.1 percent in 2030.
Interest Received by Trust Funds
Even though interest rates are projected to climb over the next 10 years, interest credited to the trust funds would decline, CBO estimates. Payments to beneficiaries are projected to outweigh revenue collections in several of the largest funds, causing balances to decline faster than interest rates rise. Without legislative action to address shortfalls, balances in three trust funds are projected to be exhausted during that period: the Highway Trust Fund in 2021, Medicare’s Hospital Insurance Trust Fund in 2024, and Social Security’s Disability Insurance Trust Fund in 2026. As the balances held by those funds decreased, interest payments and receipts would decline by about one-third, but those intragovernmental payments have no net effect on net interest outlays. Over the 2021–2030 period, by CBO’s estimate, trust funds’ interest receipts would total about $1.1 trillion.
Other Components of Net Interest
In CBO’s projections, annual receipts for other components of net interest, including investment income, climb steadily, from $49 billion in 2021 to $68 billion by 2030. Most of the projected increase stems from larger payments of interest from credit financing accounts—particularly, payments from the financing accounts for the federal student loan program (see Table 2-2). Net receipts from financing accounts are projected to increase from $34 billion in 2021 to $50 billion in 2030, totaling $437 billion over the decade.
Table 2-2.
CBO’s Projections of Other Interest
Billions of Dollars

Data sources: Congressional Budget Office; Office of Management and Budget.
Negative numbers represent the government’s interest income; positive numbers represent its interest expense.
MERCHF = Department of Defense Medicare-Eligible Retiree Health Care Fund (including TRICARE for Life); USPS = Postal Service; * = between -$500 million and zero.
a. Includes small amounts of receipts, outlays, and intragovernmental payments that could not readily be categorized.
In addition, collections by the Department of Defense Medicare-Eligible Retiree Health Care Fund continue to represent a large share of other interest collections. In CBO’s projections, interest credited to the fund grows from $11 billion in 2021 to $14 billion by 2030.
Long-Term Projections
Over the long term, CBO projects a substantial increase in interest costs, in part from a projected rise in interest rates. Because debt is already high, even moderate increases in interest rates would lead to significantly higher interest costs. Moreover, federal borrowing is projected to rise significantly, further driving up interest costs.
Beyond 2030, the interest rate on 10-year Treasury notes is projected to rise steadily, reaching 4.8 percent by 2050, and debt held by the public is projected to reach 195 percent of GDP. In CBO’s extended baseline projections, net outlays for interest grow from 2.2 percent of GDP in 2030 to more than 8 percent by 2050.2
Sensitivity of Projections
Future interest rates and deficits are uncertain and will be affected by legislative actions, economic developments, and other factors. To illustrate how changes in those variables would affect interest costs, CBO estimated those costs under different assumptions about interest rates and future deficits.3 (See Box 2-1 for more information on CBO’s forecasting methods.)
Box 2-1.
CBO’s Methods for Projecting Interest Rates
In its economic forecasts, the Congressional Budget Office projects interest rates on Treasury securities of various maturities for the current year and the following 10 years. The agency’s forecasts of rates for the 3-month Treasury bill and the 10-year Treasury note are the most important, in part because the forecasts of rates on securities of other maturities are based on those two rates. CBO’s method for projecting interest rates on Treasury securities differs by the time period the forecast covers and the maturity of the security being forecast.1
Short-Term Forecast
CBO’s forecast of the 3-month Treasury bill rate in the short term (which covers the first few years of the forecast) depends primarily on the expected path of the federal funds rate—the interest rate that financial institutions charge each other for overnight loans of their monetary reserves. The Federal Reserve sets a target for the federal funds rate that is consistent with its dual mandate of full employment and stable prices. CBO’s forecast of the federal funds rate is therefore based on factors that are likely to cause the economy to deviate from full employment and stable prices, thus prompting the Federal Reserve to adjust its target for the federal funds rate consistent with its dual mandate.
CBO’s projections of the 10-year Treasury note rate in the short term are based on the forecast of the 3-month Treasury bill rate plus a forecast of the term premium—the compensation that bondholders require for the extra risk associated with holding a long-term security instead of a series of shorter-term securities. The forecast of the term premium is based on a number of factors that determine demand for long-term securities.
Medium-Term Forecast
CBO’s forecast of interest rates over the medium term (which covers the latter half of the 10-year projection period) focuses on the 10-year Treasury note rate. CBO projects that rate by analyzing factors that affect it after the economy transitions to its average relationship with potential output. The agency considers how those factors are projected to differ in the medium term relative to their values between 1995 and 2005, a period of stable expected inflation and relatively mild economic fluctuations. CBO examined these factors:
- Growth of the Labor Force. All else being equal, slower growth in the number of workers reduces the return on government bonds and other investments.
- Domestic Private Saving. As the population ages, the number of workers in their prime saving years declines relative to the number of older people who are drawing down their savings, thereby reducing the amount of savings available for investment and boosting interest rates. In the other direction, because higher-income households tend to save a greater proportion of their income, increased income inequality (whereby an increasing share of total income goes to higher-income households) boosts savings and reduces interest rates.
- Foreign Saving. Decreasing net inflows of capital from other countries also decreases the amount of savings available for domestic investment. All else being equal, that reduction in available investment boosts rates of return on Treasury securities.
- Total Factor Productivity Growth. For a given rate of investment, lower productivity growth reduces the return on capital and results in lower interest rates, all else being equal.
- Federal Debt as a Percentage of Gross Domestic Product. Increased federal borrowing tends to crowd out private investment over time, thereby boosting interest rates.
- Risk Premium. All else being held constant, an increase in the demand for low-risk assets tends to reduce the interest rate on Treasury securities.
- Capital Share of Income. As the percentage of total income that is paid to owners of capital increases, the return on capital also increases, driving up interest rates.
CBO projects short-term interest rates over the medium term on the basis of the projected 10-year rate and a forecast of the term premium. Unlike CBO’s forecast of short-term rates, the agency’s medium-term forecast reflects factors that are likely to cause the term premium to behave differently than it has in the past.
In the transition from the short-term forecast to the medium-term forecast, CBO projects adjustments in interest rates that are consistent with the projected movement in the underlying factors. As the economy transitions from its current position to its historical relationship with potential output and as inflation reaches the Federal Reserve’s target rate, interest rates are expected to adjust to levels that are consistent with long-term trend values of the factors listed above.
1. For more details on how CBO projects interest rates, see Robert W. Arnold, How CBO Produces Its 10-Year Economic Forecast, Working Paper 2018-02 (Congressional Budget Office, February 2018), www.cbo.gov/publication/53537.
Higher or Lower Interest Rates
Forecasting interest rates is particularly challenging, even during relatively stable periods, and errors in interest rate forecasts have significantly affected CBO’s projections of interest payments.4 Higher or lower interest rates would directly affect net outlays for interest. As rates—and the government’s costs of borrowing—increase or decrease, they would raise or lower the government’s cost of rolling over its existing debt and borrowing to finance new deficits.
CBO’s forecasts of interest rates have exhibited larger mean errors than its forecasts of other economic indicators.5 In particular, CBO has overestimated interest rates during their persistent downward trend that began in the early 1980s. Although that decline is partly attributable to a lower average rate of inflation over the past two decades, the effect persists even after taking into account changes in prices. Recent research has identified several factors that may have contributed to the decline in real (inflation-adjusted) interest rates: slower output growth, increased demand for less-risky assets, the slowdown in labor force participation, increased saving in emerging market economies, the aging of the population, and increased income inequality.
Interest rates on government securities that were higher than CBO projected would raise outlays for interest on new borrowing and on debt that needed to be refinanced. (Lower interest rates would have the opposite effect.) Higher rates could result from a market reaction to large federal budget deficits and debt, actions of the Federal Reserve, and large U.S. current account deficits (that is, net inflows of capital from abroad). Those conditions can lead to potential shocks, leaving the economy more vulnerable to rapid increases in interest costs.
If interest rates for all newly issued Treasury securities were 0.1 percentage point higher in 2021 than the rates in CBO’s September baseline and that differential increased by 0.1 percentage point each year, net interest costs would be higher in each year of the projection period, the agency estimates, by amounts rising from $6 billion in 2021 to $235 billion in 2030. From 2021 through 2030, interest costs would be higher by $972 billion (see Table 2-3).
Table 2-3.
Alternative Scenarios for Net Interest Outlays
Billions of Dollars
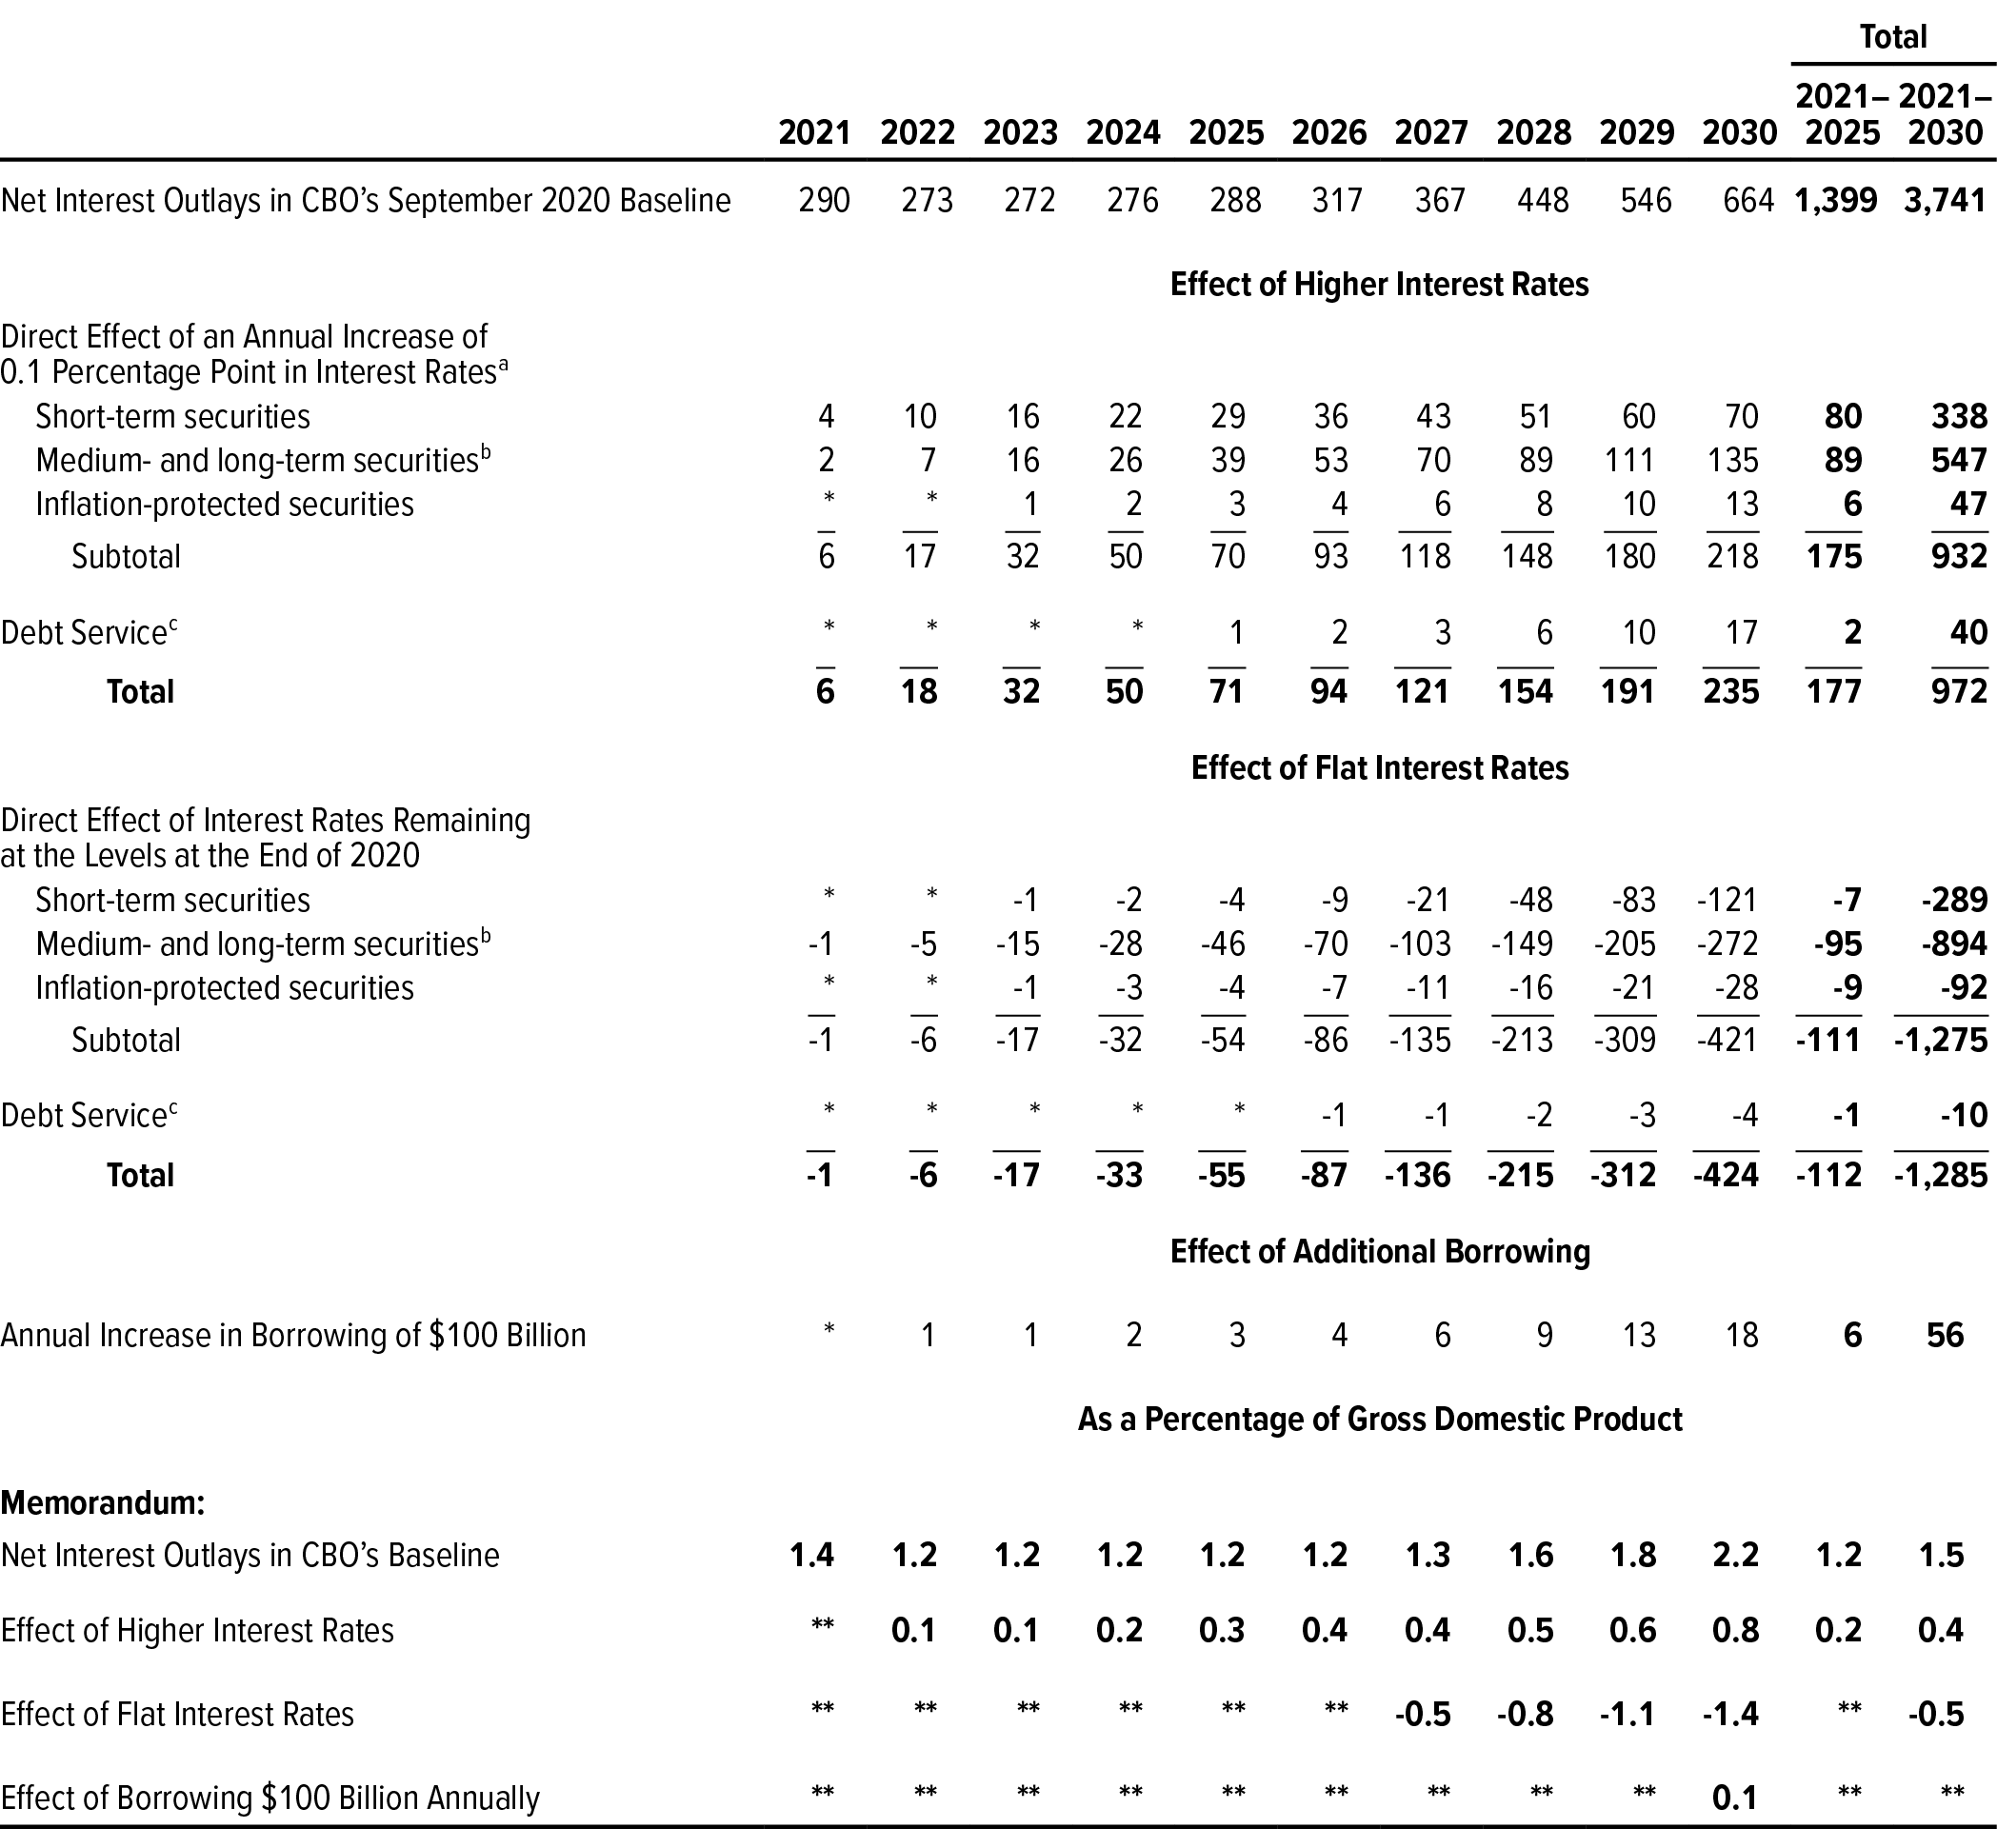
Data source: Congressional Budget Office.
* = between -$500 million and $500 million; ** = between -0.05 percent and 0.05 percent.
a. Costs on the amount of new borrowing and refinancing of maturing securities. Interest rates for all newly issued Treasury securities are assumed to be 0.1 percentage point higher in 2021 than the rates in CBO’s September baseline, and that differential increases by 0.1 percentage point each year.
b. Includes savings bonds and securities issued to state and local governments.
c. Additional borrowing needed to cover additional interest costs.
That increase in interest payments would stem from two sources: the cost of applying higher rates to the debt projected in the baseline (the direct effect) and the interest paid on the additional sums borrowed to pay those higher rates (the indirect effect). The indirect effect would occur because larger deficits generated by the larger interest payments would require the Treasury to borrow additional funds. That extra borrowing would result in further increases in the annual cost of servicing the debt.
In its projections, CBO estimates the total amount and composition of the debt that would be issued by the Treasury over the coming decade. Information from recent Treasury auctions and the Treasury’s public statements is incorporated into CBO’s estimates of the debt portfolio for the first few years. For the rest of the 10-year projection period, CBO estimates the mix of securities that the Treasury will issue: That mix would cause the weighted average of time to maturity on outstanding securities to move toward 5.5 years, roughly the average over the past decade.
Alternatively, if rates remained at the levels at which they ended 2020, net interest costs would be lower by $1 billion in 2021, by CBO’s estimate, and that differential would increase to $424 billion in 2030. From 2021 through 2030, interest costs would be lower by nearly $1.3 trillion (see Figure 2-2).
Figure 2-2.
Net Interest Outlays Under Various Interest Rate Scenarios
Percentage of Gross Domestic Product
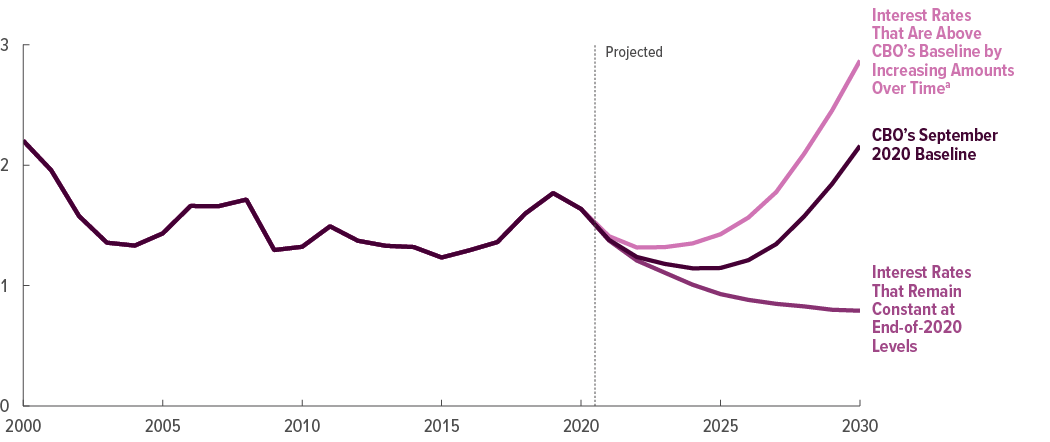
Data source: Congressional Budget Office. See www.cbo.gov/publication/56780#data.
a. Interest rates for all newly issued Treasury securities are assumed to be 0.1 percentage point higher in 2021 than the rates in CBO’s September baseline, and that differential increases by 0.1 percentage point each year (to 0.2 percentage points in 2022, 0.3 percentage points in 2023, and so forth).
Larger or Smaller Deficits
If budget deficits were larger or smaller than CBO projects, net interest costs would be correspondingly higher or lower. To illustrate the effect of larger deficits (and therefore higher debt) on interest costs, CBO estimated the effect of an increase in government borrowing. Estimates of those scenarios are generally symmetric. That is, deficits that were smaller than projected would reduce interest outlays correspondingly.
CBO calculated the effect on interest payments of borrowing that was $100 billion greater in each year of the projection period (excluding additional interest costs). That borrowing would lead to additional interest outlays of $56 billion over the 10-year period, if interest rates were not affected.
The Risks of High and Rising Debt
Because U.S. debt is high by historical standards and is projected to continue to rise, two risks emerge that could raise net interest costs far above the projected amounts. First, although the current low interest rates indicate that the debt is manageable for now and that the United States is not facing an immediate fiscal crisis, in which interest rates abruptly escalated or other disruptions occurred, the risk and potential budgetary consequences of such a crisis become greater over time. Second, less abrupt but still significant negative effects, such as higher rates of inflation and a loss of confidence in the dollar, have greater chances of occurring over time. And the rising interest costs associated with higher debt would increase interest payments to foreign holders of U.S. debt and thus reduce U.S. national income.
Those risks are influenced by various factors, including the long-term budget outlook, near-term borrowing needs, and the health of the economy. There are no identifiable tipping points in the debt-to-GDP ratio or net interest burden above which a crisis would occur. Moreover, because the United States currently benefits from the dollar’s position as the world’s reserve currency and because the federal government borrows in dollars, a fiscal crisis—similar to those that befell Argentina, Greece, or Ireland—is less likely in the United States.
1. See Congressional Budget Office, An Update to the Budget Outlook: 2020 to 2030 (September 2020), www.cbo.gov/publication/56517.
2. See Congressional Budget Office, The 2020 Long-Term Budget Outlook (September 2020), www.cbo.gov/publication/56516.
3. The alternative scenarios do not take into account any changes in GDP, inflation, or other economic factors; as a result, revenues and noninterest outlays are unchanged in the scenarios. The interest rate scenario does not reflect the effect of higher interest rates on a few interest-sensitive programs, such as student loans.
4. See Congressional Budget Office, An Evaluation of CBO’s Past Deficit and Debt Projections (September 2019), www.cbo.gov/publication/55234.
5. The mean error in CBO’s 2-year forecasts of 3-month and 10-year interest rates has been 0.5 and 0.4 percentage points, respectively. See Congressional Budget Office, CBO’s Economic Forecasting Record: 2019 Update (October 2019), www.cbo.gov/publication/55505.
About This Document
This report was prepared at the request of the Chairman of the Senate Committee on the Budget and the Ranking Member of the House Committee on the Budget. In keeping with the Congressional Budget Office’s mandate to provide objective, impartial analysis, the report makes no recommendations.
Avi Lerner wrote the report with guidance from Christina Hawley Anthony, Theresa Gullo, Leo Lex, and Sam Papenfuss. Barry Blom, Edward Gamber, Jeffrey Perry, John Seliski, and Ellen Steele provided useful comments.
Jeffrey Holland of the Peter G. Peterson Foundation, Christopher Kubeluis of the Department of the Treasury, and Diane Lim of George Washington University also provided helpful comments. The assistance of external reviewers implies no responsibility for the final product, which rests solely with CBO.
Jeffrey Kling and Robert Sunshine reviewed the report. Rebecca Lanning was the editor, and Robert Rebach was the graphics editor and cover illustrator. The report is available on CBO’s website (www.cbo.gov/publication/56780).
CBO continually seeks feedback to make its work as useful as possible. Please send any comments to communications@cbo.gov.

Phillip L. Swagel
December 2020