
At a Glance
The Congressional Budget Office regularly publishes its baseline projections of what the federal budget and the economy would look like in the current year and over the next 10 years if current laws governing taxes and spending generally remained unchanged. This report provides additional detail about the agency’s latest baseline projections, which were published earlier this month.
- The Budget. CBO projects a federal budget deficit of $3.0 trillion in 2021 as the economic disruption caused by the 2020–2021 coronavirus pandemic and the legislation enacted in response continue to boost the deficit (which was large by historical standards even before the pandemic). At 13.4 percent of gross domestic product (GDP), the deficit in 2021 would be the second largest since 1945, exceeded only by the 14.9 percent shortfall recorded last year.
In CBO’s projections, deficits fall over the next few years as pandemic-related spending wanes. They increase in most years thereafter—boosted by rising interest costs and greater spending for entitlement programs—and reach 5.5 percent of GDP in 2031. (Revenues remain largely stable relative to GDP over the projection period.)
With such deficits, federal debt held by the public totals 103 percent of GDP at the end of 2021 in CBO’s projections. Debt then falls modestly through 2024 and rises thereafter, reaching 106 percent of GDP in 2031—about equal to its previous peak, recorded in 1946.
- Changes in CBO’s Budget Projections Since February 2021. Compared with the baseline projections that CBO published in February 2021, the agency’s estimate of the deficit for this year is now $0.7 trillion (or 33 percent) larger, and its current projection of the cumulative deficit for the 2022–2031 period, $12.1 trillion, is $0.2 trillion (or 1 percent) smaller. In 2021, the costs of recently enacted legislation are partly offset by the effects of a stronger economy and technical changes (changes that are neither legislative nor economic). In later years, technical changes that reduce projected deficits more than offset the effects of recently enacted legislation and revisions to the economic forecast.
- The Economy. As the pandemic eases and demand for consumer services surges, real (inflation-adjusted) GDP in CBO’s projections grows by 7.4 percent this year and surpasses its potential (maximum sustainable) level by the end of the year. Annual output growth averages 2.8 percent from 2021 to 2025, exceeding the 2.0 percent growth rate of real potential GDP. Over the 2026–2031 period, real GDP growth averages 1.6 percent annually.
Employment grows quickly in the second half of 2021 in CBO’s projections and surpasses its prepandemic level in mid-2022. Inflation rises in 2021 to its highest rate since 2008 as increases in the supply of goods and services lag behind increases in the demand for them. By 2022, supply adjusts more quickly, and inflation falls but remains above its prepandemic rate through 2025. As the economy continues to expand over the forecast period, the interest rate on 10-year Treasury notes rises, reaching 2.7 percent in 2025 and 3.5 percent in 2031—still low by historical standards.
- Changes in CBO’s Economic Projections Since February 2021. CBO now projects stronger economic growth than it projected in February 2021 because of recently enacted legislation, the diminishing effects of social distancing, and increased consumer spending. As a result, the agency’s projections of inflation and interest rates are now higher than they were in February.
Notes
Notes
The budget and economic projections in this Congressional Budget Office report include the effects of legislation enacted through May 18, 2021, and reflect economic developments as of that date. The projections do not include budgetary or economic effects of subsequent legislation, economic developments, administrative actions, or regulatory changes.
A short report describing these projections was published on July 1, 2021, to provide the Congress with information as promptly as possible (www.cbo.gov/publication/57218).
Unless this report indicates otherwise, all years referred to in describing the budget outlook are federal fiscal years, which run from October 1 to September 30 and are designated by the calendar year in which they end. Years referred to in describing the economic outlook are calendar years.
Numbers in the text, tables, and figures may not add up to totals because of rounding.
Some of the figures in this report use shaded vertical bars to indicate periods of recession. (A recession extends from the peak of a business cycle to its trough.)
Supplemental data for this analysis are available on CBO’s website (www.cbo.gov/publication/57263#data), as are a glossary of common budgetary and economic terms (www.cbo.gov/publication/42904), a description of how CBO prepares its baseline budget projections (www.cbo.gov/publication/53532), a description of how CBO prepares its economic forecast (www.cbo.gov/publication/53537), and previous editions of this report (https://go.usa.gov/xQrzS).
Visual Summary
In this report, the Congressional Budget Office describes its projections of the federal budget and the U.S. economy under current law for this year and the decade that follows. The projected deficit for 2021 is $3.0 trillion, about $0.7 trillion larger than CBO estimated in February. That increase stems mostly from the enactment of the American Rescue Plan Act (ARPA). Over the 2022–2031 period, projected deficits are much smaller, though still large by historical standards. CBO projects stronger economic growth in the near term than it did in February 2021 because of recently enacted fiscal policies and because the agency now projects the effects of social distancing to be weaker and consumer spending to be greater than it forecast at that time.
Deficits
In CBO’s projections, this year’s deficit equals 13.4 percent of gross domestic product (GDP)—smaller than the shortfall of 14.9 percent of GDP recorded in 2020 but larger than the deficit in any other year since 1945. The budget shortfall decreases to 4.7 percent of GDP in 2022 and to 2.9 percent of GDP in 2024 as the direct budgetary effects of ARPA fade and the economy improves. Thereafter, deficits begin to rise again. By 2031, the deficit reaches 5.5 percent of GDP, significantly larger than the 3.3 percent of GDP that deficits have averaged over the past 50 years.
Percentage of GDP

Primary deficits (which exclude net interest costs) hover at about 2 percent of GDP from 2023 to 2029 and increase to 3 percent in the years that follow. Despite mounting federal debt, low interest rates cause interest payments to fall in relation to GDP through 2023. Net interest costs then increase in relation to the size of the economy—from 1.3 percent of GDP in 2024 to 2.7 percent of GDP in 2031.
Trillions of Dollars

The projected deficit for 2021 has increased by a third, mostly because of recently enacted legislation. The projected cumulative deficit for the 2022–2031 period is slightly smaller than it was in CBO’s February baseline; updates to projections of revenues and mandatory outlays were largely offsetting.
Debt
Federal debt held by the public is projected to drop from 103 percent of GDP at the end of 2021 to 99 percent in 2023 and 2024 as growth in the economy outpaces rising debt. Starting in 2025, debt steadily rises in relation to the size of the economy in CBO’s projections.
Percentage of GDP

At the end of 2031, debt is projected to reach 106 percent of GDP—about equal to its previous peak, recorded in 1946.
Outlays and Revenues
Outlays in 2021 are projected to total 31 percent of GDP—the second highest that they have been in any year since 1945, behind only outlays in 2020. In CBO’s projections, outlays decline in the near term, falling below 21 percent of GDP in 2024, and then rise, reaching 23 percent of GDP in 2031; outlays remain above their 50-year average for the entire projection period. Revenues hover around 18 percent of GDP, just above their historical average.
Percentage of GDP

Boosted by increased spending for Social Security and the major health care programs and by rising interest rates on federal debt, outlays climb in relation to GDP after 2024 in CBO’s projections. The wider-than-average gap between outlays and revenues results in growing deficits and rising debt.
Economic Output and the Labor Market: 2021 to 2025
In CBO’s projections, the economy expands rapidly over the next two years. In 2021, real (inflation-adjusted) GDP grows by 7.4 percent, largely because of increased consumer spending and a rebound in business fixed investment. Thereafter, as conditions in labor and product markets remain strong, growth in real GDP moderates.
Percentage Change

The annual growth of real GDP exceeds that of real potential (maximum sustainable) GDP until 2023 in CBO’s projections. That growth slows thereafter as real GDP returns to a level slightly below potential GDP—in accordance with their historical average relationship.
Percentage Change in Real GDP per Potential Worker From Previous Business-Cycle Peak

The recession caused by the 2020–2021 coronavirus pandemic was much sharper and more severe than any recession in recent history, but the recovery has also been unusually strong. In CBO’s projections, real GDP per potential worker grows more quickly from its level at the previous business-cycle peak than it did during most economic recoveries and expansions since World War II.
Percent

The unemployment rate is projected to decline through the remainder of 2021 and the first half of 2022 before returning to a level slightly above the noncyclical rate of unemployment—consistent with their historical average relationship.
Inflation and Interest Rates: 2021 to 2025
In CBO’s projections, inflation increases in 2021—as various factors cause supply to grow more slowly than demand in product and labor markets—and then falls in 2022. As the economy continues to expand, interest rates on federal borrowing rise but remain low by historical standards.
Percentage Change

After spiking in 2021 and falling in 2022, inflation, as measured by the price index for personal consumption expenditures (PCE), increases in 2023 and remains slightly above the Federal Reserve’s long-run goal of 2 percent for several years.
Percent

The interest rate on 3-month Treasury bills remains near zero through early 2023 and then rises as the Federal Reserve raises the federal funds rate. The interest rate on 10-year Treasury notes increases over the next decade but at a slower pace than it rose in the first few months of 2021.
The Economy: 2026 to 2031
The economy continues to expand from 2026 to 2031 in CBO’s projections but at a slower pace than it does over the first five years of the forecast period, mostly because the agency expects monetary policy to become less accommodative. Real GDP grows at an average rate of 1.6 percent per year over the 2026–2031 period.
Average Annual Percentage Change

From 2026 to 2031, real potential GDP grows in CBO’s projections at roughly the same rate as it has since the 2007–2009 recession because of faster growth in potential labor force productivity. However, growth in the potential labor force is projected to be slower than it was in previous periods, largely because of the aging of the population.
Chapter 1The Budget Outlook
Overview
The Congressional Budget Office now estimates that if no new legislation affecting revenues or outlays is enacted after May 18, 2021, the total federal budget deficit for fiscal year 2021 will be $3.0 trillion, $0.7 trillion more than the agency estimated when it last issued its baseline projections for 2021 to 2031 in February 2021. That increase results primarily from recent legislation enacted in response to the 2020–2021 coronavirus pandemic (see Appendix A). A deficit of that amount would equal 13.4 percent of gross domestic product (GDP), about 3 percentage points higher than CBO projected in February. In CBO’s projections, deficits fall for a few years after 2021 before increasing in nearly all the remaining years in the projection period. Measured as a percentage of GDP, federal debt follows a similar pattern, rising this year, falling over the next few years, and then rising every year thereafter through 2031.
Assumptions Underlying CBO’s Baseline Budget Projections
CBO’s standard procedure is to prepare its baseline budget projections in accordance with provisions set forth in the Balanced Budget and Emergency Deficit Control Act of 1985 (Public Law 99-177, referred to here as the Deficit Control Act) and the Congressional Budget and Impoundment Control Act of 1974 (P.L. 93-344). Those laws require CBO to construct its baseline under the assumptions that current laws governing revenues and spending will generally stay the same and that discretionary budget authority provided in appropriation acts in future years will match current funding, with adjustments for inflation.1
However, after consulting with the House and Senate Budget Committees, CBO deviated from that standard procedure when constructing its current baseline for discretionary spending. Because of the unusual size and nature of the emergency funding provided in legislation enacted in response to the pandemic, the agency did not extrapolate into future years the $184 billion in discretionary budget authority that has been provided for those purposes so far in 2021.2
CBO’s baseline budget projections are meant to provide a benchmark that policymakers can use to assess the potential effects of future policy; they are not intended to provide a forecast of future budgetary outcomes. Future legislative action could lead to markedly different outcomes—but even if federal laws remained unaltered for the next decade, actual budgetary outcomes would probably differ from CBO’s baseline projections because of unanticipated economic conditions and many other factors that affect federal revenues and outlays.
Deficits
In CBO’s projections, the federal budget deficit in 2021 is $126 billion less than the deficit recorded last year but more than triple the shortfall in 2019, before the onset of the pandemic. Measured relative to the size of the economy, this year’s deficit, at 13.4 percent of GDP, is smaller than the shortfall of 14.9 percent of GDP recorded in 2020 but larger than the deficit in any other year since 1945. (Before 2020, the largest deficit since the end of World War II was 9.8 percent of GDP, recorded in 2009.) Deficits continue to decline for a few years—to 4.7 percent of GDP in 2022 and to 2.9 percent in 2024—as spending provided in response to the pandemic wanes and the economy continues to improve. After 2024, deficits rise, reaching 5.5 percent of GDP by the end of the projection period in 2031 (see Table 1-1).3
Table 1-1.
CBO’s Baseline Budget Projections, by Category

Data source: Congressional Budget Office. See www.cbo.gov/publication/57263#data.
n.a. = not applicable.
a. The revenues and outlays of the Social Security trust funds and the net cash flow of the Postal Service are classified as off-budget.
b. Primary deficits exclude net outlays for interest.
The cumulative deficit for 2022 to 2031 is projected to total $12.1 trillion (or 4.2 percent of GDP); that shortfall is slightly smaller than the cumulative deficit for that period in the baseline projections that CBO published in February. Until recently, deficits tended to be small by historical standards when the economy was relatively strong over a period of several years. For example, between 1970 and 2019, deficits averaged 1.7 percent of GDP in years when the average unemployment rate for the year was below 6 percent. The unemployment rate is below 6 percent every year from 2022 to 2031 in CBO’s projections, yet the average deficit is about two and a half times that historical average.
Primary deficits—that is, deficits excluding net outlays for interest—fall from 11.9 percent of GDP in 2021 to 1.6 percent in 2024, remain near 2.0 percent for the next few years, and then increase again and reach 2.8 percent of GDP in 2031 in CBO’s projections (see Figure 1-1). From 2022 to 2031, primary deficits average 2.3 percent of GDP. Net outlays for interest fall from 1.5 percent of GDP this year to a low of 1.2 percent in 2023 and then increase over the remainder of the projection period as interest rates and federal debt rise. In 2031, net interest outlays total 2.7 percent of GDP, at which point they would equal their highest level since 1998.
Figure 1-1.
Total Deficits, Primary Deficits, and Net Interest
Percentage of GDP

In CBO’s projections, total deficits and primary deficits shrink as a percentage of GDP for the next few years. Over the latter part of the projection period, growing primary deficits (which reflect underlying trends related to the aging of the population and the rising costs of health care) and rising net interest costs increase total deficits.
Data source: Congressional Budget Office. See www.cbo.gov/publication/57263#data.
Primary deficits exclude net outlays for interest.
When October 1 (the first day of the fiscal year) falls on a weekend, certain payments that would have ordinarily been made on that day are instead made at the end of September and thus are shifted into the previous fiscal year. All projections presented here have been adjusted to exclude the effects of those timing shifts. Historical amounts have been adjusted as far back as the available data will allow.
GDP = gross domestic product.
Debt Held by the Public
The deficits projected in CBO’s baseline would boost federal debt held by the public, which consists mostly of securities that the Treasury issues to raise cash to fund the federal government’s activities and pay off its maturing liabilities. The net amount that the Treasury borrows by issuing those securities (calculated as the amounts that are sold minus the amounts that have matured) is determined primarily by the annual budget deficit. However, several other factors that are not directly included in budget totals also affect the government’s need to borrow from the public. Those factors—collectively referred to as “other means of financing”—include changes in the government’s cash balances and cash flows associated with federal credit programs, such as those related to student loans and loans to small businesses. (Only the subsidy costs of those programs are reflected in the budget deficit.)4
CBO estimates that the Treasury will decrease its cash balances by $1.3 trillion this year, from an all-time high of $1.8 trillion at the end of fiscal year 2020 to roughly $500 billion at the end of 2021—more in line with historical norms, though still higher than usual. The reduction would not affect the deficit but would result in a decrease in debt of an equal amount.
The deficit also excludes some cash disbursements for credit programs, which increase the amount the Treasury will add to the debt in 2021 by an estimated $277 billion. The largest such cash disbursements are for the Debt Relief Program run by the Small Business Administration (SBA). When all other means of financing that reconcile the estimated deficit with the Treasury’s borrowing needs are included, the increase in debt held by the public in 2021 will be $1.0 trillion less than the deficit, CBO projects, primarily because of the reduction in cash balances (see Table 1-2).
Table 1-2.
CBO’s Baseline Projections of Federal Debt
Billions of Dollars

Data sources: Congressional Budget Office; Department of the Treasury. See www.cbo.gov/publication/57263#data.
GDP = gross domestic product.
a. Factors not included in budget totals that affect the government’s need to borrow from the public. Those factors include changes in the government’s cash balances and cash flows associated with federal credit programs, such as those related to student loans. (Only the subsidy costs of those programs are reflected in the budget deficit.)
b. The value of outstanding student loans and other credit transactions, cash balances, and various financial instruments.
c. Federal debt held by the public plus Treasury securities held by federal trust funds and other government accounts.
d. The amount of federal debt that is subject to the overall limit set in law. That measure of debt excludes debt issued by the Federal Financing Bank and reflects certain other adjustments that are excluded from gross federal debt. The debt limit was most recently set at $22.0 trillion but has been suspended through July 31, 2021. On August 1, 2021, the debt limit will be raised to its previous level plus the amount of federal borrowing that occurred while the limit was suspended. CBO’s baseline projections reflect the assumption that the limit will be raised as needed. For more details, see Congressional Budget Office, Federal Debt and the Statutory Limit, February 2019 (February 2019), www.cbo.gov/publication/54987.
After all the government’s borrowing needs are accounted for, debt held by the public rises from $21.0 trillion at the end of 2020 to $35.8 trillion at the end of 2031 in CBO’s baseline projections. As a percentage of GDP, debt at the end of 2031 stands at 106 percent, about 6 percentage points higher than it was at the end of 2020 and nearly two and a half times its average over the past 50 years (see Figure 1-2).
Figure 1-2.
Federal Debt Held by the Public, 1940 to 2031
Percentage of GDP

By 2031, federal debt held by the public is projected to exceed 106 percent of GDP—about equal to debt in 1946, when it was the highest it has ever been.
Data source: Congressional Budget Office. See www.cbo.gov/publication/57263#data.
GDP = gross domestic product.
Another measure of debt excludes the value of the government’s financial assets. That measure, debt net of financial assets, reflects the government’s overall financial condition by accounting for government spending that results in the acquisition of financial assets, such as student loans. Still another measure—which excludes Treasury securities held by the Federal Reserve in addition to those financial assets—better reflects the government’s overall effect on credit markets. In CBO’s baseline projections, that measure increases from $13.6 trillion (or 65 percent of GDP) at the end of 2020 to $28.4 trillion (or 84 percent of GDP) at the end of 2031. (Federal debt held by the Federal Reserve, which totaled $4.4 trillion at the end of 2020, increases to $5.3 trillion at the end of 2021 and to $6.4 trillion in 2023, where it remains until 2025; thereafter, such debt declines, falling to $4.8 trillion in 2031.)
Outlays and Revenues in 2021
In CBO’s projections, spending related to the pandemic causes outlays to remain elevated this year. At 30.6 percent of GDP, projected outlays for 2021 are slightly lower than those recorded in 2020 (31.2 percent of GDP) but still significantly higher than their annual average over the past 50 years (20.6 percent of GDP). By contrast, revenues are projected to increase, from 16.3 percent of GDP in 2020 to 17.2 percent in 2021, close to their historical average of 17.3 percent (see Figure 1-3).
Figure 1-3.
Total Outlays and Revenues
Percentage of Gross Domestic Product

Outlays are projected to drop from recent highs as pandemic-related spending wanes and then trend upward, as they did before the pandemic. Revenues are projected to hover around their historical average as a share of the economy.
Data source: Congressional Budget Office. See www.cbo.gov/publication/57263#data.
When October 1 (the first day of the fiscal year) falls on a weekend, certain payments that would have ordinarily been made on that day are instead made at the end of September and thus are shifted into the previous fiscal year. All projections presented here have been adjusted to exclude the effects of those timing shifts. Historical amounts have been adjusted as far back as the available data will allow.
Outlays
In CBO’s projections, federal outlays in 2021 total $6.8 trillion—about $0.3 trillion (or 4 percent) more than the amount recorded in 2020. (Because GDP is projected to grow faster than outlays this year, outlays fall in relation to the size of the economy despite the increase in nominal terms.) Nearly all of that growth is attributable to mandatory outlays. Recently enacted legislation—primarily the American Rescue Plan Act of 2021 (P.L. 117-2, enacted on March 11, 2021)—increased projected outlays for this year by $1.1 trillion and, along with legislation enacted in 2020 in response to the pandemic, contributes significantly to keeping outlays in 2021 high by historical standards. (By comparison, in 2019, outlays totaled 21.0 percent of GDP, nearly 10 percentage points less than CBO projects for 2021.)
Mandatory Spending. Mandatory, or direct, spending includes outlays for some federal benefit programs and for certain other payments to people, businesses, nonprofit institutions, and state and local governments. Such outlays are generally governed by statutory criteria and are not normally constrained by the annual appropriation process.5 Certain types of payments that federal agencies receive from the public and from other government agencies (such as premiums paid by Medicare beneficiaries and payments made by federal agencies to employees’ retirement plans) are classified as offsetting receipts and are accounted for in the budget as reductions in mandatory spending.
The Deficit Control Act requires CBO to construct baseline projections for most mandatory spending under the assumption that current laws continue unchanged.6 Therefore, CBO’s baseline projections of mandatory spending reflect the estimated effects of changes in the economy, growth in the number of beneficiaries of certain mandatory programs, and other factors related to the costs of those programs. The projections also incorporate a set of across-the-board reductions in budgetary resources (known as sequestration) that are required under current law for some mandatory programs.
In 2021, CBO estimates, total mandatory outlays (net of offsetting receipts) will amount to $4.9 trillion under current law, $284 billion (or 6 percent) more than they were in 2020 (see Table 1-3). As a share of GDP, those outlays are projected to amount to 21.7 percent—about the same share as last year, which was the highest percentage recorded since at least 1962 (the earliest year for which such data have been reported). For some programs, outlays exceed the amounts recorded in 2020; for others, outlays have declined but remain well above their prepandemic level.
Table 1-3.
CBO’s Baseline Projections of Mandatory Outlays
Billions of Dollars

Data source: Congressional Budget Office. See www.cbo.gov/publication/57263#data.
Data on outlays for benefit programs in this table generally exclude administrative costs, which are discretionary.
MERHCF = Department of Defense Medicare-Eligible Retiree Health Care Fund (including TRICARE for Life); * = between zero and $500 million.
a. Excludes the effects of Medicare premiums and other offsetting receipts. (Net Medicare spending, which includes those offsetting receipts, is shown in the memorandum section of the table.)
b. When October 1 (the first day of the fiscal year) falls on a weekend, as it will in calendar years 2022, 2023, and 2028, certain payments that would ordinarily have been made on that day are instead made at the end of September and thus are shifted into the previous fiscal year.
c. Premium tax credits are federal subsidies for health insurance purchased through the marketplaces established under the Affordable Care Act. Related spending consists almost entirely of payments for risk adjustment and outlays for the Basic Health Program.
d. Includes outlays for recovery rebates for individuals, the American Opportunity Tax Credit, and other credits.
e. Includes outlays for Temporary Assistance for Needy Families, Child Support Enforcement, Child Care Entitlement to States, the Child Care and Development Block Grant, and other programs that benefit children.
f. Includes benefits for retirement programs in the civil service, foreign service, and Coast Guard; benefits for smaller retirement programs; and annuitants’ health care benefits.
g. Includes veterans’ compensation, pensions, and life insurance programs. (Outlays for veterans’ health care are classified as discretionary.)
h. Cash payments from Fannie Mae and Freddie Mac to the Treasury are recorded as offsetting receipts in 2020 and 2021. Beginning in 2022, CBO’s estimates reflect the net lifetime costs—that is, the subsidy costs adjusted for market risk—of the guarantees that those entities will issue and of the loans that they will hold. CBO counts those costs as federal outlays in the year of issuance.
i. Includes premium payments, recoveries of overpayments made to providers, and amounts paid by states from savings on Medicaid’s prescription drug costs.
The following programs have the largest projected increases in 2021:
- Refundable tax credits. Outlays for refundable tax credits total $706 billion in 2021 in CBO’s projections, $327 billion more than the amount recorded in 2020. Most of that increase—$287 billion—stems from the recovery rebates for individuals that were provided in response to the pandemic.7 In addition, a temporary expansion of the child tax credit for 2021 boosts mandatory outlays by $45 billion.
- Coronavirus State and Local Fiscal Recovery Funds. In 2020 and 2021, lawmakers provided direct assistance to state, local, tribal, and territorial governments in response to the pandemic. Outlays for such assistance will total $284 billion this year, CBO estimates, significantly more than the $149 billion recorded in 2020.
- Medicaid. Outlays for the program will total $519 billion this year, CBO estimates, an increase of $61 billion (or 13 percent) from last year. That spending is boosted by two provisions enacted in response to the public health emergency caused by the pandemic. The first raised the portion of Medicaid costs that the federal government must cover. The second required that states maintain coverage for almost all Medicaid enrollees regardless of any changes in their income or circumstances that would otherwise cause them to become ineligible for the program. Both provisions are set to remain in place for the duration of the public health emergency, which CBO anticipates will continue through July 2022.
- Supplemental Nutrition Assistance Program (SNAP). Outlays for SNAP are projected to total $145 billion this year, an increase of $59 billion (or 69 percent) from last year. Much of that increase stems from recently enacted legislation that increased SNAP benefits for 2021 and expanded the program that allows states to provide benefits to replace meals that children would otherwise have received at school. A projected increase in SNAP enrollment and an ongoing program that allows states to provide households with additional benefits during the public health emergency will also boost outlays this year. (By comparison, outlays for SNAP totaled $63 billion in 2019.)
CBO anticipates that outlays for a number of other programs will be lower in 2021 than they were in 2020 but remain well above their prepandemic amounts. Those programs include the following:
- Unemployment compensation. Outlays for unemployment compensation, which soared to $472 billion in 2020, are projected to fall to $380 billion in 2021. Despite that drop, they remain well above the $28 billion recorded for such benefits in 2019, mostly because legislation extended pandemic-related unemployment benefits through September 2021. In addition, the unemployment rate and the number of people claiming benefits are expected to remain elevated in 2021 (but lower than they were in 2020).
- Small Business Administration loans. Mandatory outlays for the SBA will total $323 billion in 2021, CBO estimates, down from $552 billion in 2020 but still very high by historical standards. (Such outlays totaled −$1 billion in 2019, reflecting a downward revision to the subsidy costs of loans made in previous years.) The Paycheck Protection Program accounts for most of that change; outlays for the program are projected to fall from $526 billion in 2020 to $290 billion this year.
- Higher education. CBO estimates that outlays for higher education will fall from $124 billion in 2020 to $108 billion in 2021. (Those outlays will still be well above the $33 billion they totaled in 2019.) That drop in outlays occurs primarily because the $95 billion upward revision to the subsidy costs of student loans disbursed in previous years that the Administration plans to record in 2021 is smaller than the revision recorded in 2020 (though it is still much larger than the 2019 revision).8 The 2020 and 2021 revisions were made primarily to account for updated projections of income of borrowers with income-driven repayment plans, which would result in lower repayments of principal and payments of interest by those borrowers.
Taken together, outlays for all other mandatory programs are estimated to rise, on net, by $40 billion (or 2 percent) in 2021. The largest of those changes are for the following programs:
- Medicare. Outlays for Medicare (net of offsetting receipts) will fall by $86 billion (or 11 percent) in 2021, to $683 billion, CBO projects. That decrease is largely the result of two factors. First, whereas Medicare made payments totaling roughly $100 billion to providers through accelerated and advance payment programs in 2020, it is not making such payments in 2021. Second, CBO expects recoupment of those 2020 payments to decrease outlays by $35 billion in 2021.
- Social Security. Outlays for Social Security are estimated to increase by $39 billion (or 4 percent) in 2021, to $1.1 trillion, as a result of growth in the average benefit payment and the number of beneficiaries.
- Emergency rental assistance. Support to state, local, tribal, and territorial governments to assist households in making rent and utility payments will increase outlays in 2021 by $34 billion.
- Agriculture. Outlays for major agriculture programs will increase by $17 billion in 2021, to a total of $48 billion, CBO estimates. That increase is largely the result of continued spending on the Coronavirus Food Assistance Program, which provides assistance to farmers, ranchers, and consumers affected by the pandemic. Recently enacted legislation related to the pandemic will also increase outlays for agriculture programs in 2021, CBO estimates.
Changes in mandatory spending for a variety of other programs and activities—including subsides for health insurance, veterans’ programs, and federal retirement programs—account for the rest of the increase.
Discretionary Spending. Discretionary spending encompasses an array of federal activities that are funded through or controlled by appropriations. That category includes most defense spending; spending for many nondefense activities, such as elementary and secondary education, housing assistance, international affairs, and the administration of justice; and outlays for highway programs.9 In any year, some discretionary outlays arise from budget authority provided in the same year, and some arise from appropriations made in previous years.
Discretionary funding for 2021 is governed by limits, or caps, that were previously set in law.10 (No statutory caps are in place for years after 2021.) Some elements of discretionary funding are not constrained by the caps. For most of those exceptions, the caps are adjusted to accommodate the funding provided. In particular, adjustments to the caps are made for all appropriations designated for emergency requirements and overseas contingency operations (OCO) in accordance with section 251 of the Deficit Control Act.11 Subject to certain limits, additional adjustments are made for funding designated for disaster relief activities, some efforts to reduce overpayments in benefit programs, and wildfire suppression.
Two types of spending neither count toward the caps nor result in an adjustment to the caps: a portion of funding—up to amounts specified in law—for certain activities authorized by the 21st Century Cures Act (P.L. 114-255) and a small portion of funding provided for 2021 in division N of the Consolidated Appropriations Act, 2021 (P.L. 116-260).12
By CBO’s estimate, discretionary budget authority for 2021 totals $1.6 trillion, $284 billion (or 15 percent) less than the amount provided in 2020. That total for 2021 includes $295 billion for emergency requirements, OCO, and other activities not constrained by the caps (see Table 1-4).13 The drop in budget authority in 2021 mostly stems from a significant reduction in funding for activities that have been designated as emergency requirements in accordance with the Deficit Control Act. Funding for such activities totaled $487 billion in 2020; so far in 2021, $192 billion has been provided for such activities. Almost all of the emergency funding for 2020 and 2021 was provided in legislation enacted in response to the ongoing pandemic.
Table 1-4.
CBO’s Baseline Projections of Discretionary Spending
Billions of Dollars

Data source: Congressional Budget Office. See www.cbo.gov/publication/57263#data.
Nondefense discretionary outlays are usually greater than budget authority because of spending from the Highway Trust Fund and the Airport and Airway Trust Fund that is subject to obligation limitations set in appropriation acts. The budget authority for such programs is provided in authorizing legislation and is considered mandatory.
n.a. = not applicable.
a. The amount of nondefense budget authority for 2020 and 2021 does not match the sum of the caps on funding and the adjustments to the caps. That occurs mostly because net reductions in mandatory budget authority stemming from provisions in appropriation acts for those years were credited as offsets to new discretionary budget authority when the acts’ compliance with the caps was determined. In CBO’s baseline projections, those changes to mandatory budget authority appear in their normal mandatory accounts.
b. Some discretionary funding related to certain types of activities is not constrained by the caps; for most of those activities, the caps are adjusted to accommodate such funding, up to certain limits. Specifically, appropriations designated for overseas contingency operations and for activities designated as emergency requirements are assumed to grow with inflation after 2021, and the caps are adjusted accordingly. (After consulting with the House and Senate Budget Committees, CBO did not extrapolate into future years the discretionary funding designated as an emergency requirement that was provided in legislation enacted specifically in response to the 2020–2021 coronavirus pandemic because of the unusual size and nature of that funding.) For three other activities—disaster relief, wildfire suppression, and certain efforts to reduce overpayments in benefit programs—the extent to which the caps can be adjusted is subject to annual constraints, as specified in law. There are two additional exceptions: A portion of funding for certain activities authorized by the 21st Century Cures Act (P.L. 114-255) and a small portion of funding provided by division N of the Consolidated Appropriations Act, 2021 (P.L. 116-260), that was originally classified as mandatory spending do not count toward the caps but do not result in an adjustment to the cap limits. (After consulting with the budget committees, CBO did not extrapolate the latter amount into future years.)
CBO anticipates that if no further appropriations are provided this year, discretionary outlays will total $1.7 trillion in 2021—$25 billion (or 2 percent) more than they were last year. Outlays rise in 2021 even as the budget authority provided falls, primarily because of the large increase in budget authority provided in 2020.
In CBO’s projections, discretionary funding for defense totals $741 billion in 2021, including $69 billion for OCO. Defense outlays, which amounted to $714 billion in 2020, increase by $25 billion (or 4 percent), to $739 billion. Outlays for military personnel increase by $7 billion, as do outlays for operation and maintenance. Outlays for procurement and outlays for research and development each increase by $4 billion.
For 2021, nondefense discretionary funding totals $874 billion in CBO’s baseline projections. That total includes $225 billion that is not limited by the caps on discretionary funding. Of that amount, $222 billion resulted in cap adjustments—$192 billion for activities designated as emergency requirements, $17 billion for disaster relief, $8 billion for OCO, $2 billion for efforts to reduce overpayments in benefit programs, and $2 billion for wildfire suppression. The remaining amounts—$3 billion in appropriations stemming from division N of the Consolidated Appropriations Act, 2021, and $0.5 billion for 21st Century Cures Act programs—are not subject to the caps and did not result in cap adjustments.
Under current law, CBO expects that nondefense discretionary outlays will total $914 billion in 2021, about the same as they totaled in 2020; that estimate is the result of some large, but mostly offsetting, changes in 2021. Outlays from the Public Health and Social Services Emergency Fund will fall by $36 billion in 2021, and spending on disaster loans will fall by $22 billion, CBO estimates. Those reductions are projected to mostly be offset by a $16 billion increase in outlays from the Education Stabilization Fund, a $10 billion increase in transit infrastructure grants, and a number of smaller increases in spending for a variety of programs.
Net Interest. In the budget, net interest outlays primarily consist of the government’s interest payments on federal debt, offset by interest income that the government receives. Net outlays for interest are dominated by the interest paid to holders of the debt that the Treasury issues to the public. The Treasury also pays interest on debt issued to trust funds and other government accounts, but such payments are intragovernmental transactions that have no effect on the budget deficit.
Although debt held by the public is set to increase by 9 percent from 2020 to 2021, net outlays for interest are projected to fall by $15 billion this year, to $331 billion (or 1.5 percent of GDP). That drop occurs primarily because the average interest rate paid by the Treasury has been lower in 2021 than it was in 2020. Partially offsetting that reduction, inflation has been higher in 2021, resulting in larger increases in the principal of inflation-protected securities. Because those increases are recorded as interest outlays, higher inflation raises net outlays for interest.
Revenues
Despite the economic disruptions that resulted from the pandemic and the actions taken in response, federal revenues declined by only 1 percent in 2020, totaling $3.4 trillion (or 16.3 percent of GDP). Those receipts reflect income generated and economic activity that occurred before and after the disruptions began and the federal government responded by enacting legislation and implementing other policy changes.
On the basis of receipts recorded through May 2021, CBO anticipates that revenues will rise by 12 percent this year to reach $3.8 trillion (or 17.2 percent of GDP). That growth is projected to occur even though CBO expects the effects of social distancing measures put in place to curb the spread of COVID-19 (the disease caused by the coronavirus) and of legislation enacted since March 2020 (including the American Rescue Plan Act) to continue to weigh on receipts this year.
The projected growth in receipts largely reflects increases in collections of individual and corporate income taxes, which are expected to grow this year by 21 percent and 13 percent, respectively. Recent collections from both of those sources, which include taxes withheld from workers’ paychecks as well as final payments of taxes for the 2020 tax year and estimated payments of taxes for both 2020 and 2021, have been greater than CBO anticipated when it made its projections earlier this year. Those collections were more robust than the amounts implied by currently available data on the economy given the past relationship between the level of economic activity and revenues. The specific reasons for those greater-than-anticipated collections will become clearer as detailed information about taxable income from individual and corporate income tax returns becomes available over the next two years.
Outlays and Revenues From 2022 to 2031
In nominal terms, federal outlays are projected to fall by nearly $1.5 trillion (or 21 percent) over the next two years before growing at an average annual rate of nearly 5 percent over the remainder of the projection period. Revenues increase by about $0.5 trillion (or 14 percent) in 2022 in CBO’s projections and then grow by about 3 percent per year, on average, through 2031.
Outlays
In CBO’s baseline projections, federal outlays fall from $6.8 trillion this year to $5.5 trillion in 2022 and to $5.4 trillion in 2023 and 2024. Thereafter, outlays rise, reaching $7.8 trillion in 2031.
Measured relative to the size of the economy, federal outlays fall in CBO’s projections from 31 percent of GDP in 2021 to just under 21 percent in 2024, roughly the same as the share recorded in 2019 (see Figure 1-4). Both mandatory and discretionary outlays decline in relation to GDP through 2024 as spending related to the pandemic falls. Net outlays for interest fall in 2022 and 2023, primarily because interest rates remain low by historical standards. Federal outlays generally increase after 2024, reaching 23 percent of GDP in 2031. That growth stems from rising interest rates and underlying trends related to the aging of the population and the rising costs of health care.
Figure 1-4.
Outlays, by Category
Percentage of Gross Domestic Product

Every category of spending drops in the near term. In later years, rising spending for Social Security and the major health care programs boosts mandatory outlays, and net interest costs increase as interest rates and federal debt rise.
Data source: Congressional Budget Office. See www.cbo.gov/publication/57263#data.
When October 1 (the first day of the fiscal year) falls on a weekend, certain payments that would have ordinarily been made on that day are instead made at the end of September and thus are shifted into the previous fiscal year. All projections presented here have been adjusted to exclude the effects of those timing shifts. Historical amounts have been adjusted as far back as the available data will allow.
Mandatory Spending. In CBO’s baseline projections, outlays for mandatory programs (net of offsetting receipts) fall from nearly 22 percent of GDP in 2021 to about 13 percent in 2024 and then rise in most years thereafter, reaching 15 percent of GDP by 2031. (Such outlays averaged just over 10 percent of GDP each year from 1971 to 2020.) That pattern occurs mostly because spending related to the pandemic falls over the next few years and two underlying factors—the aging of the population and rapid growth in federal health care costs—put upward pressure on mandatory outlays. The aging of the population causes the number of participants in Social Security and Medicare to grow faster than the overall population, and federal health care costs per beneficiary continue to rise faster than GDP per capita. As a result of those two trends, outlays for Social Security and Medicare increase in relation to GDP between 2021 and 2031 (see Table 1-5). The effects of those trends on federal spending will persist beyond the projection period.
Table 1-5.
Key Projections in CBO’s Baseline
Percentage of Gross Domestic Product

Data source: Congressional Budget Office. See www.cbo.gov/publication/57263#data.
This table satisfies a requirement specified in section 3111 of S. Con. Res. 11, the Concurrent Resolution on the Budget for Fiscal Year 2016.
a. Consists of outlays for Medicare (net of premiums and other offsetting receipts), Medicaid, and the Children’s Health Insurance Program, as well as subsidies for health insurance purchased through the marketplaces established under the Affordable Care Act and related spending.
b. Includes payroll taxes other than those paid by the federal government on behalf of its employees; those payments are intragovernmental transactions. Also includes income taxes paid on Social Security benefits, which are credited to the trust funds.
c. Does not include outlays related to the administration of the program, which are discretionary. For Social Security, outlays do not include intragovernmental offsetting receipts stemming from the employer’s share of payroll taxes paid to the Social Security trust funds by federal agencies on behalf of their employees.
d. The net increase in the deficit shown in this table differs from the change in the trust fund balance for the associated program. It does not include intragovernmental transactions, interest earned on balances, or outlays related to the administration of the program.
Social Security and the Major Health Care Programs. Outlays for Social Security and the major health care programs, net of offsetting receipts, are projected to dip to 10.6 percent of GDP in 2022 and to increase in most years thereafter, reaching 12.8 percent in 2031.14 (Spending for the major health care programs consists of outlays for Medicare, Medicaid, and the Children’s Health Insurance Program, as well as subsidies for health insurance purchased through the marketplaces established under the Affordable Care Act and related spending.)
CBO’s current baseline includes the following projections of outlays for specific programs:
- Outlays for Social Security fall slightly in 2022 to 4.9 percent of GDP in 2022 and then rise steadily thereafter, reaching 6.0 percent of GDP in 2031.
- Outlays for Medicare equal 3.0 percent of GDP in 2022 and rise to 4.3 percent of GDP in 2031.
- Federal outlays for Medicaid are relatively stable as a percentage of GDP over the coming decade, averaging about 2 percent each year.
- Outlays for subsidies for health insurance purchased through the marketplaces and related spending average 0.2 percent of GDP per year through 2031.
Other Mandatory Programs. Aside from spending on Social Security and the major health care programs, all other mandatory spending is projected to drop by 6.8 percentage points in 2022, to 4.1 percent of GDP, as the effects of pandemic-related spending dissipate. (Such spending was 2.7 percent of GDP in 2019.) The category “other mandatory spending” includes spending on income support programs (such as unemployment compensation and the Supplemental Nutrition Assistance Program), military and civilian retirement programs, most veterans’ benefits, and major agriculture programs.
In CBO’s baseline projections, other mandatory spending declines more gradually as a share of GDP after 2022, falling to 2.1 percent in 2031. The projected decline occurs in part because benefit amounts for many of those programs are adjusted for inflation each year, and in CBO’s economic forecast, inflation is less than the rate of growth of nominal GDP (see Chapter 2).
Discretionary Spending. In accordance with section 257 of the Deficit Control Act, CBO bases its projections of discretionary spending for individual accounts on the most recent funding and applies the appropriate inflation rate to project funding for future years.15 Because the caps on discretionary appropriations expire after 2021, most budget authority after that year is assumed to grow with inflation for the duration of the baseline projection period.
The $10 billion of funding projected for emergency requirements in 2022 is a sharp reduction from the $192 billion of such funding provided for 2021. Nearly all of that amount—$184 billion—was provided in response to the coronavirus pandemic. Because of the unusual size and nature of that pandemic-related funding, CBO, after consulting with the House and Senate Budget Committees, deviated from the standard procedures that it uses to construct its baseline and did not extrapolate into future years that $184 billion when projecting discretionary budget authority.
In CBO’s projections, total discretionary budget authority falls in 2022, from $1.6 trillion to $1.5 trillion. After 2022, funding rises by an average of 2.6 percent each year through the end of the projection period. Total discretionary outlays, however, remain near $1.6 trillion from 2022 to 2025 as spending of the pandemic-related funding provided in 2020 and 2021 declines. After 2025, outlays begin to rise again, reaching $1.9 trillion in 2031. Measured as a share of GDP, discretionary outlays decrease steadily, from 6.8 percent in 2022 to 5.6 percent in 2030 and 2031—which would be the smallest share on record. By comparison, discretionary outlays averaged 8.2 percent of GDP over the past 50 years, although they were as low as 6.0 percent of GDP in 1999.
Defense. In CBO’s projections, budget authority for defense programs—including funding for OCO—is $763 billion in 2022, an increase of $22 billion (or 2.9 percent) from the total amount provided in 2021. After 2022, defense funding is projected to grow by an average of 2.5 percent each year and to reach $954 billion in 2031. Projected outlays for defense programs total $751 billion in 2022 and then grow at a rate similar to that of budget authority, rising to $923 billion in 2031. Despite that growth in nominal terms, discretionary defense outlays measured as a percentage of GDP are projected to fall from 3.1 percent in 2022 to 2.7 percent in 2031—lower than they have ever been since they were first reported in1962.
Nondefense. Total budget authority for nondefense discretionary programs is projected to drop significantly in 2022, from $874 billion to $714 billion, primarily because CBO did not extrapolate into future years the $184 billion in nondefense emergency funding that was provided in response to the pandemic in 2021 in its baseline.16 After 2022, funding is projected to grow by 2.6 percent a year, on average, and to reach $899 billion in 2031.
As outlays associated with the government’s response to the pandemic decline, discretionary outlays for nondefense programs are projected to decrease, from $899 billion in 2022 to $818 billion in 2024. (CBO estimates that about one-third of the $184 billion in nondefense discretionary funding provided in 2021 in response to the pandemic will be spent in this fiscal year and that about 95 percent will be spent by 2024.) After 2024, nondefense outlays begin to rise again in CBO’s projections; in 2031, they reach $954 billion. Relative to the size of the economy, outlays for nondefense discretionary programs fall from 3.7 percent of GDP in 2022 to 2.8 percent of GDP in 2031—lower than any previously reported level.
Net Interest. The two main factors that affect the federal government’s net interest costs are the amount of debt held by the public and the interest rates on Treasury securities.17 In CBO’s projections, debt held by the public (in nominal terms) increases by roughly 55 percent from 2021 to 2031. Although interest rates rise throughout the period, they remain low by historical standards for the next few years. As debt matures and is refinanced at prevailing lower interest rates, the average interest rate on federal debt dips.18 In 2021, the average interest rate on debt held by the public is estimated to be 1.7 percent; that rate falls to 1.4 percent in 2022 and 2023 in CBO’s projections and rises thereafter, reaching 2.7 percent in 2031.
Initially, the effects of those lower interest rates more than offset the effects of the projected increase in federal debt. As a result, net outlays for interest in CBO’s projections decline from 1.5 percent of GDP in 2021 to 1.2 percent in 2023. Thereafter, rising rates and the projected increases in federal debt cause net outlays for interest measured as a share of the economy to more than double after 2023 in CBO’s projections. In 2031, such outlays reach 2.7 percent of GDP—0.7 percentage points higher than their 50-year average.
Revenues
After this year, as income continues to rise and the effects of the economic disruptions caused by the pandemic and of the legislation enacted in response dissipate, revenues are projected to grow to 18.1 percent of GDP in 2022 and to fluctuate between 17.5 percent and 18.1 percent of GDP through 2031 (see Figure 1-5). That variation in overall receipts reflects different patterns among the major revenue sources.
Figure 1-5.
Revenues, by Category
Percentage of Gross Domestic Product

Receipts of individual and corporate income taxes are expected to rise in 2022 as the economy recovers and temporary provisions enacted in response to the pandemic expire. Individual income taxes are projected to rise again following scheduled increases in taxes after 2025.
Data source: Congressional Budget Office. See www.cbo.gov/publication/57263#data.
Individual Income Taxes. If current laws generally remained unchanged, receipts from individual income taxes would rise from 8.7 percent of GDP in 2021 to 9.6 percent in 2022, CBO projects, largely because of the expiration of temporary provisions enacted in response to the pandemic and because employers who deferred payment of their portion of certain payroll taxes in 2020 and 2021 would begin making those payments in 2022.19 Individual income tax receipts are projected to decline to 8.8 percent of GDP in 2025, in part because payments of deferred taxes are due in 2022 and 2023 but not in subsequent years.
In addition, individual income tax collections in 2020 and 2021 were greater than the amounts implied by currently available data on economic activity and the past relationship between tax revenues and the state of the economy. Those larger-than-anticipated receipts might reflect higher wage or nonwage income or larger realizations of capital gains in those years, or perhaps the temporary tax provisions enacted in response to the pandemic were not as widely used as anticipated. Depending on which factors explain those larger receipts from individual income taxes, their effects on receipts might be expected to persist permanently, end abruptly, or even reverse. In CBO’s projections, the unexplained strength gradually dissipates over the next few years. Between 2025 and 2031, individual income tax receipts are projected to rise to 9.5 percent of GDP as the result of scheduled increases in taxes after 2025, real bracket creep, and other factors.20
Corporate Income Taxes. In CBO’s baseline projections, corporate income tax receipts rise from 1.1 percent of GDP in 2021 to 1.5 percent of GDP in 2023, remain at that level through 2025, and then gradually decline, reaching 1.2 percent of GDP in 2031. Those receipts will be boosted over the next several years by the expiration of temporary provisions enacted in response to the pandemic and scheduled changes to tax rules enacted in the 2017 tax act (P.L. 115-97). After 2025, corporate income taxes measured as a share of GDP are projected to decline because of the end of the scheduled payments of a onetime tax on previously untaxed foreign profits and because profits are projected to grow more slowly than GDP.
Payroll Taxes. Receipts from payroll taxes, which fund social insurance programs—primarily Social Security and Medicare—typically remain stable as a share of wages because workers’ earnings constitute most of the payroll tax base. In CBO’s projections, payroll taxes as a percentage of GDP decrease by a total of 0.2 percentage points from 2021 to 2031, mostly because collections of unemployment insurance taxes decline. States’ unemployment insurance trust funds were depleted as a result of unusually high unemployment during the past year. Some states have begun to replenish the balances of those funds by collecting more in unemployment taxes from employers, but those collections are expected to return to typical prepandemic levels by 2031. (States collect the unemployment taxes that they use to replenish their trust funds, but those taxes count as federal revenues, reflecting the nature of the unemployment insurance system, which is a federal program administered by the states.)
Remittances From the Federal Reserve. Remittances from the central bank, which began to rise in 2020, are expected to continue rising, from 0.4 percent of GDP this year to 0.6 percent by 2023, as the Federal Reserve significantly increases its asset holdings, which boost its earnings. In CBO’s projections, short-term interest rates remain low through 2023, holding down the amounts the Federal Reserve must pay to depository institutions on their reserves. Interest rates begin to rise in 2024, and the Federal Reserve’s asset holdings begin to shrink slowly in relation to economic output, reducing remittances. By 2029, remittances stabilize around 0.3 percent of GDP.
Receipts From Other Sources. Receipts from all other sources are expected to vary by less than 0.1 percent of GDP over the next decade.
- Revenues from estate and gift taxes are projected to rise by less than 0.1 percent of GDP in 2027 after a provision of the 2017 tax act that doubled the amount of the estate and gift tax exemption expires at the end of calendar year 2025.21
- Customs duties, which are assessed on certain imports, are projected to decline through 2031 by a total of less than 0.1 percent of GDP. That decline is partly because imports other than oil are projected to grow more slowly than GDP over the next decade.
- Excise taxes are projected to rise slightly in 2022 as the economy recovers but then to gradually decline, along with the tax bases on which many excise taxes are levied, every year thereafter, ultimately by a total of less than 0.1 percent of GDP.
The federal government also collects revenues in the form of miscellaneous fees and fines. CBO projects that, under current law, revenues from those sources would grow at about the same pace as GDP through 2031.
Uncertainty in the Budget Outlook
CBO’s baseline budget projections are intended to show what would happen to federal spending, revenues, deficits, and debt if current laws governing spending and taxes generally remained the same. Changes to laws—particularly those affecting fiscal policies—that caused them to differ from the laws underlying CBO’s baseline projections could lead to budgetary outcomes that diverged considerably from those in the baseline. For example, CBO’s estimate of the deficit for 2021 has increased by more than $0.7 trillion since February, largely as a result of laws that have been enacted since those projections were published.
Even if federal laws remained the same for the next decade, actual budgetary outcomes would differ from CBO’s baseline projections because of unanticipated changes in economic conditions and in other factors that affect federal spending and revenues. Because of the ongoing coronavirus pandemic, the current projections are subject to an unusually high degree of uncertainty. That uncertainty stems from many sources, including incomplete knowledge about how the pandemic will unfold, how effective monetary and fiscal policy will be, and how global financial markets will respond to the substantial increases in federal deficits and debt. CBO aims for its projections to be in the middle of the distribution of possible outcomes, given the baseline assumptions about federal tax and spending policies, and recognizes that actual outcomes will typically differ from such projections.
CBO’s projections of outlays and revenues—and therefore of deficits and debt—depend in part on the agency’s economic projections for the coming decade, which include forecasts for such variables as interest rates, inflation, and growth in productivity. Discrepancies between those forecasts and actual economic outcomes can cause significant differences between baseline budget projections and budgetary outcomes.
Although the agency’s current economic and budget projections are subject to an unusually high degree of uncertainty, particularly in the near term, a comparison of CBO’s past projections with actual outcomes gives some indication of the magnitude of the uncertainty of budget projections.22 On the basis of an analysis of its past projections, CBO estimates that there is approximately a two-thirds chance that, under current law, the deficit in 2022 would be between 3.8 percent and 5.7 percent of GDP. (The baseline projection of the deficit that year is 4.7 percent of GDP.) The range in 2026 would be larger: CBO estimates that, under current law, there is approximately a two-thirds chance that the deficit that year would be between 1.4 percent and 6.1 percent of GDP. (The baseline projection is 3.7 percent of GDP.)
1. Budget authority is the funding provided by federal law to incur financial obligations that will result in immediate or future outlays of federal government funds.
2. CBO also did not extrapolate into future years $3 billion in funding provided for 2021 in division N of the Consolidated Appropriations Act, 2021 (P.L. 116-260). The agency classified that amount, which was also provided in response to the pandemic, as mandatory funding in its cost estimate but reclassified it as discretionary funding in its July 2021 baseline. About $8 billion in emergency funding provided for other purposes is projected to continue in the future, with increases to account for inflation each year after 2021.
3. Because October 1 will fall on a weekend in calendar years 2022, 2023, and 2028, certain payments that are due on those days will be made at the end of September instead, thus shifting them into the previous fiscal year. In CBO’s projections, those shifts noticeably boost outlays and deficits in fiscal years 2022 and 2028 but reduce them in fiscal years 2024 and 2029. If not for those shifts, deficits would decline in each year between 2021 and 2023 and increase as a percentage of GDP in all but one year between 2024 and 2031.
4. For more details on other means of financing and on federal debt more broadly, see Congressional Budget Office, Federal Debt: A Primer (March 2020), www.cbo.gov/publication/56165.
5. Each year, some mandatory programs are modified by provisions in annual appropriation acts. Such changes may increase or decrease spending for the affected programs for one or more years. In addition, some mandatory programs, such as Medicaid, the Supplemental Nutrition Assistance Program, and benefits for Coast Guard retirees and annuitants, are considered mandatory but require benefits to be paid from amounts provided in appropriation acts.
6. Section 257 of the Deficit Control Act also requires CBO to project spending for certain mandatory programs beyond their scheduled expiration and to project spending for entitlement programs, including Social Security and Medicare, under the assumption that they will be fully funded, and thus able to make all scheduled payments, even if the trust funds associated with those programs do not have sufficient resources to make full payments. Other rules that govern the construction of CBO’s baseline projections have been developed by the agency in consultation with the House and Senate Budget Committees. For further details, see Congressional Budget Office, How CBO Prepares Baseline Budget Projections (February 2018), www.cbo.gov/publication/53532.
7. The Treasury has classified all of the recovery rebates paid in advance of tax return filings as outlays rather than as reductions in revenues.
8. CBO does not estimate those revisions to subsidy costs; rather, that total reflects the amount that the Office of Management and Budget has indicated that it will record in fiscal year 2021.
9. The budget authority for highway programs is provided in authorizing legislation and is considered mandatory.
10. Most discretionary funding is limited by caps that were originally specified in the Budget Control Act of 2011 (P.L. 112-25) and modified by subsequent legislation. See Congressional Budget Office, cost estimate for the Bipartisan Budget Act of 2019 (July 23, 2019), www.cbo.gov/publication/55478. Under current law, separate caps exist for defense and nondefense funding through 2021. If the total amount of discretionary funding provided in appropriation acts for a given year exceeds the cap for either category, the President must sequester—or cancel—a sufficient amount of budgetary resources (following procedures specified in the Budget Control Act) to eliminate the breach.
11. Overseas contingency operations are certain military and diplomatic activities in Afghanistan and elsewhere, although some funding designated for OCO has not been directly related to those activities.
12. In its cost estimate for division N of P.L. 116-260, CBO classified the funding provided as mandatory in keeping with section 1401 of division O of that legislation. See Congressional Budget Office, cost estimate for division N, Additional Coronavirus Response and Relief, of H.R. 133, Consolidated Appropriations Act, 2021, enacted as P.L. 116-260 on December 27, 2020 (January 14, 2021), www.cbo.gov/publication/56961. After consulting with the Office of Management and Budget, CBO reclassified nearly $3.4 billion of that funding as discretionary in its July baseline projections because that funding was provided for activities that have historically received discretionary funding.
13. The amount that is constrained by the caps—$1,320 billion—is $22 billion more than the overall limit on discretionary funding for this year; that excess occurs primarily because appropriation acts for 2021 included provisions that were estimated to reduce budget authority for mandatory programs on net. When an appropriation act includes changes that affect mandatory funding, the estimated changes are included in estimates of discretionary funding that it provides when assessing whether the act complies with the limits on budget authority. Once the legislation is enacted, however, any such changes are incorporated into CBO’s baseline projections for mandatory spending. The opposite occurs when authorizing legislation provides funding for activities that traditionally receive discretionary appropriations.
14. Offsetting receipts include mostly payments of premiums, recoveries of overpayments made to providers, and amounts paid by states from savings on Medicaid’s prescription drug costs.
15. The Deficit Control Act specifies which measures of inflation CBO should use to construct its projections: The employment cost index for wages and salaries of workers in private industry is used to adjust discretionary funding related to federal personnel, and the gross domestic product price index is used to adjust other discretionary funding.
16. Similarly, CBO did not extrapolate into future years the $3 billion in funding provided for 2021 in division N of the Consolidated Appropriations Act, 2021 (P.L. 116-260), that the agency had originally classified as mandatory but reclassified as discretionary in its July 2021 baseline. That funding—which was also provided in response to the pandemic—supports programs and activities that historically receive discretionary appropriations.
17. Inflation rates also affect net outlays for interest, mostly for Treasury inflation-protected securities, which differ from other securities in that their principal amounts are adjusted to account for inflation.
18. For more details on the government’s net interest costs, see Congressional Budget Office, Federal Net Interest Costs: A Primer (December 2020), www.cbo.gov/publication/56780.
19. Although some of those provisions affect payroll taxes, they will not change the amounts credited to the Social Security and Railroad Retirement trust funds, and the effects are being recorded in the budget—at least for now—as reductions in individual income tax collections.
20. Real bracket creep is the process in which, as income rises faster than inflation (as generally happens when the economy is expanding), a larger portion of income is pushed into higher tax brackets and thus becomes subject to higher tax rates. It occurs because the income tax brackets are indexed to inflation. Other parameters of the tax system, such as the amount of the child tax credit, are fixed in nominal dollars and are not adjusted for inflation. In CBO’s projections, real bracket creep causes receipts from individual income taxes to grow throughout the entire projection period. For further information, see Congressional Budget Office, “How Income Growth Affects Tax Revenues in CBO’s Long-Term Budget Projections” (June 2019), www.cbo.gov/publication/55368.
21. For more on CBO’s projections of estate and gift taxes, see Congressional Budget Office, Understanding Federal Estate and Gift Taxes (June 2021), www.cbo.gov/publication/57129.
22. See Congressional Budget Office, An Evaluation of CBO’s Past Deficit and Debt Projections (September 2019), www.cbo.gov/publication/55234.
Chapter 2The Economic Outlook
Overview
This chapter provides details about the Congressional Budget Office’s July 2021 economic projections, which the agency used as the basis for updating its budget projections. Both sets of projections were published earlier this month.1
The forecast for 2021 to 2031 is rooted in current economic conditions: In the second quarter of 2021, CBO estimates that real economic output (that is, output adjusted to remove the effects of inflation) grew at an annual rate of 8.4 percent as the 2020–2021 coronavirus pandemic eased and demand for consumer services surged. The increase followed a 6.4 percent increase in the first quarter of 2021. The strong economic growth in the first half of 2021 was accompanied by a marked increase in inflation.
The Economic Outlook for 2021 to 2025
In CBO’s projections—which incorporate the assumptions that current laws (as of May 18) governing federal taxes and spending generally remain in place and that no significant additional funding or aid is provided—output exceeds its potential (maximum sustainable) level from 2021 to 2025, and demand for labor remains strong.
- Real gross domestic product (GDP) grows rapidly this year. Output increases by 7.4 percent and surpasses its potential level by the end of 2021 (see Figure 2-1). The annual growth of real GDP averages 2.8 percent during the five-year period from 2021 to 2025, exceeding the 2.0 percent growth rate of real potential GDP.
Figure 2-1.
The Relationship Between GDP and Potential GDP
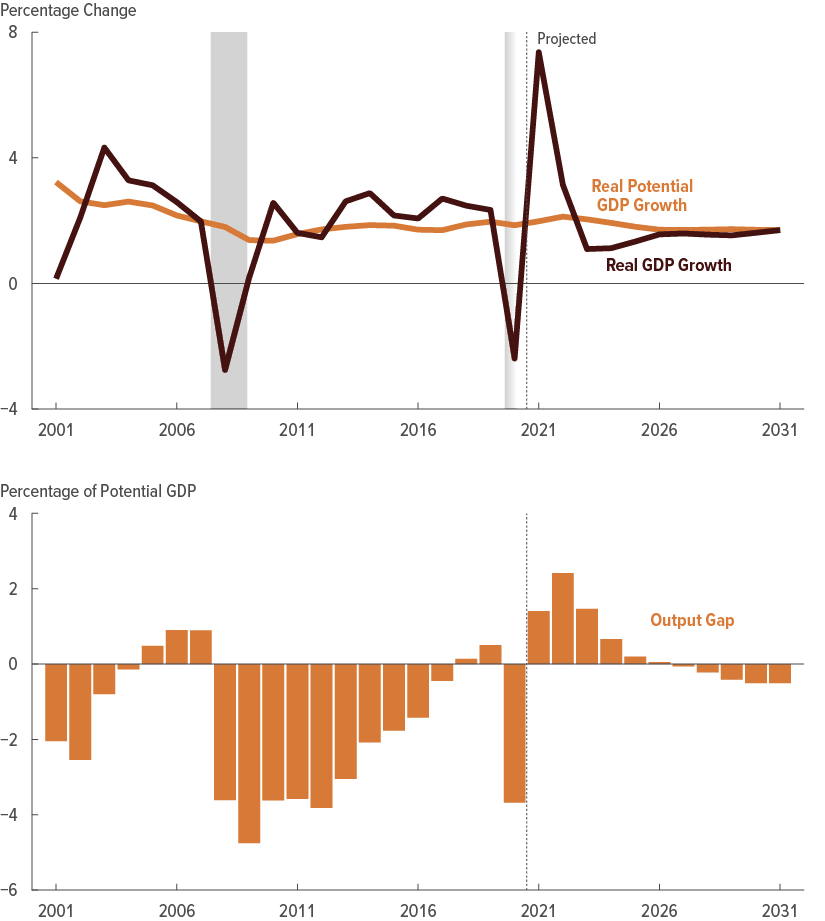
In CBO’s projections, the annual growth of real (inflation-adjusted) GDP exceeds that of real potential GDP until 2023.
The gap between real GDP and real potential GDP (that is, the output gap) rises above 2 percent by 2022 before moving back toward its historical average.
Data source: Congressional Budget Office. See www.cbo.gov/publication/57263#data.
Real values are nominal values that have been adjusted to remove the effects of changes in prices. Potential GDP is CBO’s estimate of the maximum sustainable output of the economy. Growth of real GDP and of real potential GDP is measured from the fourth quarter of one calendar year to the fourth quarter of the next.
The output gap is the difference between GDP and potential GDP, expressed as a percentage of potential GDP. A positive value indicates that GDP exceeds potential GDP; a negative value indicates that GDP falls short of potential GDP. Values for the output gap are for the fourth quarter of each year.
GDP = gross domestic product.
- Labor market conditions continue to improve. Employment grows quickly in the second half of 2021, reflecting increased demand for goods and services and the waning of factors dampening the supply of labor, including health concerns and enhanced unemployment insurance benefits. Employment surpasses its prepandemic level in mid-2022. The unemployment rate declines through 2022 and then remains below or near 4 percent for several years (see Table 2-1). The labor force participation rate rises through 2022 and then remains above or near 62 percent for several years.2
Table 2-1.
CBO’s Economic Projections for Calendar Years 2021 to 2031

Data sources: Congressional Budget Office; Bureau of Economic Analysis; Bureau of Labor Statistics; Federal Reserve. See www.cbo.gov/publication/57263#data.
Economic projections for each year from 2021 to 2031 appear in Appendix C.
GDP = gross domestic product; PCE = personal consumption expenditures; * = between zero and 0.05 percentage points.
a. Real values are nominal values that have been adjusted to remove the effects of changes in prices.
b. Excludes prices for food and energy.
c. The consumer price index for all urban consumers.
d. The employment cost index for wages and salaries of workers in private industries.
e. Value for the fourth quarter of 2025.
f. Value for the fourth quarter of 2031.
g. The average monthly change, calculated by dividing by 12 the change in payroll employment from the fourth quarter of one calendar year to the fourth quarter of the next.
h. Data for 2020 are based on data released after CBO completed its economic forecast. Projections are based on data available on May 18, 2021.
i. Adjusted to remove distortions in depreciation allowances caused by tax rules and to exclude the effect of inflation on the value of inventories.
j. Net measure of transactions between the United States and the rest of the world in goods, services, income, and unilateral transfers.
- Inflation is higher than it has been since 2008 and then moderates. The growth rate of the price index for personal consumption expenditures (PCE) increases to 2.8 percent in 2021, as increases in the supply of goods and services lag behind increases in the demand for them, adding to inflationary pressures. By 2022, supply adjusts more quickly, and PCE price inflation falls to 2.0 percent during the year. After 2022, PCE price inflation remains at 2.1 percent through 2025, above its rate before the pandemic.
- Interest rates on federal borrowing remain low but rise as the economy continues to expand. The Federal Reserve maintains the federal funds rate (the rate that financial institutions charge each other for overnight loans of their monetary reserves) near zero through late 2023 and then gradually raises that rate. The interest rate on 10-year Treasury notes rises from 1.6 percent in the middle of 2021 to 2.7 percent by the end of 2025 as the Federal Reserve reduces the pace of its asset purchases and investors anticipate that short-term interest rates will begin rising in the next few years.
The Economic Outlook for 2026 to 2031
In CBO’s forecast, economic output expands less rapidly from 2026 to 2031 than in the previous five years. Real GDP grows by 1.6 percent per year, on average. Real potential GDP grows at a slightly faster rate. The level of real GDP remains above the level of real potential GDP through 2026, and inflation is above its average rate since the 2007–2009 recession. Eventually, less accommodative monetary policies help push GDP slightly below potential GDP, in accordance with their historical average relationship, and inflation falls.
In CBO’s projections, productivity growth is faster over the 2026–2031 period than it has been since the 2007–2009 recession. However, potential output still grows less rapidly than it has over the past 30 years, partly because of slower productivity growth but mainly because of an ongoing, long-term slowdown in the growth of the labor force.
Uncertainty in the Economic Outlook
CBO attempts to construct its projections so that they fall in the middle of the range of possible outcomes under current law. Projections made this year are subject to an unusually high degree of uncertainty, which stems from many sources: the response of prices in labor and product markets to tightness in those markets and to the speed at which supply-side factors affecting that tightness unwind, the course of the pandemic, the way the Federal Reserve pursues its longer-run goals, the effectiveness of monetary and fiscal policies, and the risk of a sharp drop in the value of assets. As a result, the economy could expand at a substantially faster or slower pace than CBO currently projects. Labor market conditions could likewise be better or worse than projected. Also uncertain are the pace of potential output and the impact of the pandemic on productivity, the labor force, and technological innovation over the longer term.
Comparison With CBO’s Previous Projections
CBO currently projects stronger economic growth than it did in February 2021, largely for three reasons.3 First, the agency expects recently enacted fiscal policies to boost output. Second, CBO projects that the effects of social distancing on economic activity in 2021 will be smaller than the effects it projected in February, reflecting a more rapid return to normalcy. Third, CBO has raised its estimate of consumer spending out of the additional savings that households accumulated during the pandemic.
As a result, the agency’s projections of inflation are higher than the projections it made in February, as output now exceeds its potential level sooner and to a larger degree than previously projected. In addition, those projections are higher in 2021 as producers struggle to keep pace with surging demand for goods and services and as the factors discouraging labor supply, including health concerns and enhanced unemployment insurance benefits, boost wages and prices. Interest rates are also projected to be higher than CBO expected in February, reflecting the more positive outlook for economic growth.
Current Conditions: Recovery From the Pandemic-Induced Recession
Economic activity has expanded rapidly since April 2020, but the expansions of supply and demand have been unbalanced at times. Consumer demand for many products, particularly services, has increased in part because of more widespread immunity to the virus, income support from fiscal policies in 2020 and 2021, and the greater household wealth resulting from increased prices in the stock market, increased home prices, and accumulated savings during the pandemic. Supply has not risen as quickly in some instances, causing tightness in some labor and product markets. That tightness has put upward pressure on consumer prices, producer prices, and wages over the past few months.
The Coronavirus Pandemic
In mid-2021, many people have acquired immunity to the virus from infection or vaccination. Extensive real-world evidence now shows that the vaccines authorized for use in the United States are effective. The number of new infections fell sharply on a national basis starting in January. By June, infection rates in many parts of the country were down to their lowest levels since the early days of the pandemic. The extent of social distancing—both voluntary and mandated—has likewise decreased as the winter virus surge abated, and the pace of economic activity has quickened.
Gross Domestic Product
CBO estimates that real GDP exceeded its previous peak in the second quarter of 2021 after plunging when social distancing began in March and April 2020. In 2020, the shortfall in demand was concentrated in services, reflecting the disproportionate impact of social distancing on in-person activities; in 2021, as the number of new infections remains low, the expansion in demand will also be concentrated in services. Consumer spending rose sharply during the first quarter as households received federal payments provided by legislation enacted in December and March, with greater gains in spending for goods than for services. In the second quarter, CBO estimates that the gain in consumer spending on services was larger than the gain in consumer spending on goods.4 Consumer spending on services is projected to lead the expansion thereafter.
The Labor Market
Labor market conditions improved in the first half of 2021, continuing the rebound from the pandemic shock of early 2020. Nonetheless, compared with their prepandemic levels, household and nonfarm payroll employment did not fully recover, the unemployment rate remained elevated, and labor force participation remained below the rate that CBO projected in January 2020. Labor supply factors—including the lingering role of pandemic-related health concerns and the incentive effects of expanded unemployment compensation—reduced employment, increased unemployment, and reduced labor force participation during the first half of this year.
Employment. Nonfarm payroll employment and household employment began a rebound in May 2020 that continued through June 2021, following the sharp declines in the first two months of the pandemic. According to the Bureau of Labor Statistics, the U.S. economy lost 22 million nonfarm payroll jobs during March and April 2020, and close to 25 million workers became unemployed or dropped out of the labor force. Nonfarm payroll employment has regained about 16 million jobs, and household employment has increased by 18 million workers through June 2021. After adding 7.7 million jobs in May and June 2020, followed by 3.3 million jobs in July and August, the economy added 461,000 jobs per month through June 2021, on average, CBO estimates. Payroll employment remained about 4 percent below its prepandemic level in June 2021.
The degree of job loss and the pace of the rebound in employment differed by industry. Through June 2021, recovery in three sectors—retail trade, transportation and warehousing, and construction—considerably outpaced the recovery in other sectors. The strong employment growth in the first two sectors reflects, among other things, the strong growth in consumer spending on goods that began in May 2020, as households shifted their demand from services to goods because of social distancing. Meanwhile, a boom in the residential housing market contributed to strong employment growth in the construction sector. By contrast, employment in the leisure and hospitality industry initially declined by nearly 50 percent; although it has since rebounded, it remains 13 percent below its prepandemic level. In the spring of 2021, that rebound in employment was exceeded by the rise in job openings in the industry, suggesting that health concerns and the incentive effects of enhanced unemployment compensation dampened the supply of labor. As a result of the various industry-specific differences, employment, unemployment, and labor market participation differed between women and men and by other demographic characteristics (see Box 2-1).
Box 2-1.
Effects of the Pandemic on the Employment of Men and Women, by Race and Ethnicity
The effects of the 2020–2021 coronavirus pandemic on employment varied considerably for workers with different demographic characteristics (see the figure). The composition of industries in which a demographic group was employed in February 2020 accounts for almost all of the differences between groups in the changes in employment of each group since then.
Effects on Employment of Men and Women in Different Race-Ethnicity Groups
Between February and April 2020, the employment-to-population ratio declined by 11 percentage points for men and 12 percentage points for women.1 In accordance with that overall result, the decline in that ratio was similar for women and men in the White, Black, and Hispanic groups. By contrast, the decline for Asian and other men was about 3 percentage points larger than for women in that group.2
By the spring of 2021, for each group, the employment-to-population ratio had rebounded substantially but was still below its prepandemic level. The ratio was farther below its prepandemic level for Hispanic men and women than for the other groups. How far that ratio was below its prepandemic level was similar for men and women in each race-ethnicity group—though the decline for non-White women was slightly greater than that for non-White men, including the Asian and others group, for whom it had fallen more for men than women in the early months.
Effects of Industry Composition
About half of the decline in employment between February and April 2020 occurred in 11 out of 264 industries.3 (The industry with the largest decline, for example, was restaurants and other food services.) Much work in those 11 industries relies on in-person interactions. The same 11 industries also accounted for about half of the rebound in employment between April 2020 and April 2021. For example, the industry with the largest rebound was restaurants and other food services.
Except in the Hispanic group, those industries employed larger percentages of women than of men. About one-third of women and one-third of Hispanic men worked in those industries (see the table).
Percentage of Workers Employed in the 11 Industries Most Affected by the Pandemic in February 2021

Data source: Congressional Budget Office. See www.cbo.gov/publication/57263#data.
The Congressional Budget Office analyzed changes in employment-to-population ratios by dividing them into two components: one associated with the industries in which workers in each demographic group were employed (industry composition) and a second associated with how much a group’s employment changed compared with all workers in those industries. CBO estimates that the industry composition of workers accounted for almost all of the decline in the employment-to-population ratio of each group between February 2020 and April 2020 and for almost all of the rebounds since then.
Difference in Employment-to-Population Ratio Since the Business-Cycle Peak
Percentage Points

Data source: Congressional Budget Office, using Current Population Survey data from IPUMS-CPS. See www.cbo.gov/publication/57263#data.
The gray lines in each panel show the patterns of the other population groups for comparison. Data are not seasonally adjusted and are shown with final, not composite, weights. CBO reclassified “employed, absent from work for other reasons, unpaid” as unemployed.
The change is measured against the employment peak of the previous business cycle, which is February 2020.
1. Because a smaller share of women than men were employed in February 2020, a similar percentage-point decline in the employment-to-population ratio was associated with a greater percentage decline in employment: 22 percent for women (12 percentage points from their 56 percent employment-to-population ratio), compared with 17 percent for men (11 percentage points from their 66 percent employment-to-population ratio). CBO’s calculation of employment-to-population ratios is based on data from the Current Population Survey (CPS). The Bureau of Labor Statistics, which publishes employment, unemployment, and other labor statistics using the CPS each month, noted that starting in March 2020, many workers who should have been classified as “unemployed on temporary layoff” were probably misclassified as “employed absent from work” in the CPS, causing the employment statistics to understate the magnitude of employment decline during the pandemic-induced recession. In calculating the employment-to-population ratio, CBO reclassified “employed absent from work for other reasons, unpaid” as unemployed. Without that reclassification, the share of population employed in April and May 2020 would have been 2.4 percentage points and 1.7 percentage points higher, respectively.
2. In the 2007–2009 recession, the employment-to-population ratio for men fell more than that for women in each of the four race-ethnicity groups, and those declines occurred over a nearly two-year period. CBO used race and ethnicity to define four race-ethnicity categories—Hispanic, Black, White, and Asian and other—through the following steps. Respondents who identified their ethnicity as Hispanic were classified as Hispanic, regardless of the race or races they identified. Of respondents not already classified as Hispanic, those who identified their race as African American were classified as Black, regardless of whether they identified other races as well. Of respondents not already classified as Hispanic or Black, those who identified a race other than White were classified as Asian and other. Finally, respondents not classified as Hispanic, Black, or Asian and other were classified as White.
3. Listed in order of the decline in employment, those 11 industries are restaurants and other food services; construction; elementary and secondary schools; other amusement, gambling, and recreation industries; beauty salons; general medical and surgical hospitals and specialty (except psychiatric and substance abuse) hospitals; child day care services; travelers’ accommodations; motor vehicles and motor vehicle equipment manufacturing; clothing stores; and dentists’ offices.
Unemployment. The unemployment rate and the number of unemployed people have declined from their peak levels of early 2020, but progress has slowed since October 2020, and they remain higher than their prepandemic levels of February 2020. After surging in early 2020, from 3.5 percent in February to nearly 15 percent in April, the unemployment rate declined to 6.9 percent by October 2020 and then to 5.9 percent by June 2021. The number of unemployed people rose in early 2020, from 5.7 million in February to 23.1 million in April, and then declined to 11.0 million by October 2020 and 9.5 million by June 2021.
Labor Force Participation. The labor force participation rate dropped sharply at the beginning of the pandemic and then rebounded over the summer of 2020, recovering about half of the decline. Since that time, however, the recovery in labor force participation has largely stalled. As of June 2021, the overall labor force participation rate among the civilian noninstitutionalized population age 16 or older stood at 61.6 percent, little changed from late summer 2020. That level is 1.8 percentage points below its prepandemic peak level of 63.4 percent.
Inflation and Interest Rates
Inflation was low at the beginning of 2021, but consumer price indexes increased sharply in recent months, reflecting strong demand and supply constraints in some product and labor markets. Over the 12-month period ending in January 2021, the overall PCE price index increased by 1.4 percent, far below the Federal Reserve’s 2 percent long-run goal for inflation. By May, that 12-month rate was 5.0 percent. The high 12-month growth rate results partly from sharp increases in prices over the past few months and partly from price declines experienced in the spring of 2020, when social distancing peaked and disrupted economic activity nationwide. The consumer price index for used cars and trucks increased by 10.0 percent in April 2021, its largest one-month increase ever, and by 7.3 percent in May as a shortage of semiconductors used in manufacturing new vehicles pushed more consumers to purchase used ones. The consumer price index for household furniture and bedding increased by 2.1 percent in April, its largest one-month increase in more than three decades, and by 1.9 percent in May as the demand for lumber combined with supply constraints and trade restrictions sent the price of building materials soaring. Although prices have risen rapidly over the past 12 months, CBO estimates that the overall consumer price level in the second quarter of 2021 remains near the level that the agency projected for that period before the pandemic. Nevertheless, the growth of prices in May—when measured relative to prices two years earlier, before the pandemic—was the largest of any month since the pandemic began.
Long-term interest rates have increased during the first half of 2021, probably boosted by an improved economic outlook. The 10-year Treasury note rate increased from 0.9 percent at the end of 2020 to 1.5 percent in June 2021. Additionally, some of the increase in long-term interest rates in early 2021 was probably due to investors’ expectation of additional federal legislation beyond what the Congress had passed when CBO completed its forecast on May 18.
Policy Responses to the Pandemic
Policymakers have taken a wide variety of actions in response to the coronavirus pandemic. Several federal laws were enacted, and various administrative actions (including delayed tax-filing deadlines, suspension of student loan payments, and foreclosure moratoriums) were taken to address the public health emergency and to assist households, businesses, and state and local governments affected by the pandemic-induced recession. The Federal Reserve also acted to address the rapid deterioration in economic and labor market conditions in 2020. In addition, various levels of government announced stay-at-home orders, business closures, bans on public gatherings, travel restrictions, and other measures. The laws and policy responses taken through May 18, 2021, are reflected in CBO’s current-law projections. Those projections thus incorporate estimates of the economic effects of all the pandemic-related legislation enacted in 2020 and the American Rescue Plan Act of 2021 (ARPA; Public Law 117-2) enacted in March 2021.
In March and April 2020, several laws were enacted in response to the pandemic. CBO estimated that those laws added $2.3 trillion, or 11.0 percent of GDP, to the deficit in fiscal year 2020 and $0.6 trillion, or 2.6 percent of GDP, in 2021.5 The Coronavirus Preparedness and Response Supplemental Appropriations Act, 2020 (P.L. 116-123), and the Families First Coronavirus Response Act (P.L. 116-127) increased federal funding for some federal agencies and for state and local governments, required employers to grant paid sick leave to employees, and provided payments and tax credits to employers. The Coronavirus Aid, Relief, and Economic Security (CARES) Act (P.L. 116-136) provided loans to businesses, payments to health care providers, payments and tax credits to individuals, additional funding to state and local governments, and reductions in certain business taxes. Finally, the Paycheck Protection Program and Health Care Enhancement Act (P.L. 116-139) increased federal funding for the loans to businesses and payments to health care providers supplied in the CARES Act.
In December 2020, lawmakers enacted the Consolidated Appropriations Act, 2021 (P.L. 116-260). Along with appropriating funds for the remainder of the current fiscal year, the legislation provided additional funding for federal agencies to respond to the public health emergency created by the pandemic and provided financial support to households, businesses, and nonfederal governments affected by the economic downturn. Around the time of enactment, CBO estimated that the pandemic-related provisions in that legislation would add $774 billion, or 3.5 percent of GDP, to the deficit in fiscal year 2021 and $98 billion, or 0.4 percent of GDP, in 2022.6
In 2021, recently enacted legislation—primarily ARPA—increases projected deficits, excluding any debt service effects, by $1.1 trillion, or 5.0 percent of GDP, in fiscal year 2021 and by $0.5 trillion, or 2.0 percent of GDP, in fiscal year 2022, mostly as a result of higher federal spending. The largest budgetary effects stem from additional funding to respond to the public health emergency created by the pandemic and additional financial support to households, businesses, and nonfederal governments affected by the economic downturn, among other measures. CBO estimates that recently enacted legislation will boost the level of real GDP by 1.0 percent in calendar year 2021 and by 2.7 percent in calendar year 2022 (see Appendix B).
The pandemic-related legislation has increased federal debt as a percentage of GDP; in the longer term, CBO expects that increase—along with the large debt and added borrowing under the budget deficits projected before the pandemic—to raise borrowing costs, lower economic output, and reduce the income of U.S. households and businesses. In addition, high and rising debt increases the risk of a fiscal crisis or of less abrupt economic changes, such as higher inflation or the undermining of the U.S. dollar’s predominant role in global financial markets.
The Economic Outlook for 2021 to 2025
In CBO’s projections, the economy expands rapidly over the next two years. Much of that growth stems from increases in consumer spending initially led by growth in spending on services. To fulfill the increased demand for their products, businesses increase both investment and hiring. In 2021, shortages in product and labor markets put upward pressure on many prices and wages. Those shortages ease by the end of the year, in CBO’s projections, relieving much of that upward pressure, as product markets adjust and as factors that discourage labor supply dissipate.
After 2021, in CBO’s projections, as labor and product market conditions remain strong, inflation remains relatively stable and slightly exceeds the Federal Reserve’s 2 percent long-run goal for several years. As the unemployment rate falls to low levels, wage growth increases as businesses try to fill vacancies from a smaller number of unemployed workers. In order to anchor long-term inflation expectations at 2 percent, the Federal Reserve seeks to achieve inflation that averages 2 percent over time. In accordance with that stated goal, CBO projects that the Federal Reserve will increase the target range for the federal funds rate once inflation has reached 2 percent and is on track to exceed that rate for a time. As interest rates rise, output growth slows and inflationary pressures subside.
Gross Domestic Product
CBO projects a rapid recovery and a strong expansion relative to previous business cycles (see Figure 2-2). The agency expects output per worker to return to its level at the business-cycle peak, which occurred at the end of 2019, more quickly than the average from several previous recoveries. In CBO’s projections, the level of real GDP per worker 12 quarters after the previous peak is above the middle two-thirds of the range from several previous recoveries.
Figure 2-2.
Real GDP per Potential Worker Across Business Cycles
Percentage Change From Previous Peak

The pandemic-induced recession was much sharper and more severe than any recession in recent history, but the recovery has also been unusually strong. In CBO’s projections, real GDP per potential worker grows more quickly from its level at the previous business-cycle peak than it has during most economic recoveries and expansions since World War II.
Data source: Congressional Budget Office. See www.cbo.gov/publication/57263#data.
The potential labor force is CBO’s estimate of the size of the labor force that would occur if economic output and other key variables were at their maximum sustainable amounts.
The full range of business cycles analyzed includes the 10 most recent cycles. The oldest cycle peaked in 1948, and the most recent cycle peaked at the end of 2019. The business cycle that peaked in January 1980 is excluded from the figure because by July 1981 a new cycle had already begun. The middle two-thirds of the full range is formed by removing the two highest and two lowest observations.
Real values are nominal values that have been adjusted to remove the effects of changes in prices.
GDP = gross domestic product.
Under the assumption that current laws governing federal taxes and spending generally remain in place and no significant additional funding or aid is provided, real GDP grows by 7.4 percent in 2021, measured from the fourth quarter of 2020 to the fourth quarter of 2021, in CBO’s projections. The expansion is driven by a strong rebound in consumer spending and supported by a marked pickup in real business investment following the large declines that occurred in early 2020 (see Table 2-2). Real GDP returns to its previous peak level during the first half of 2021 and expands at a 2.8 percent annual rate from the middle of 2021 through 2025.
Table 2-2.
Projected Growth of Real GDP and Its Components
Percent

Data source: Congressional Budget Office. See www.cbo.gov/publication/57263#data.
Real values are nominal values that have been adjusted to remove the effects of changes in prices.
Data are annual. Changes are measured from the fourth quarter of one calendar year to the fourth quarter of the next.
GDP = gross domestic product; * = between zero and 0.05 percentage points.
a. Consists of personal consumption expenditures.
b. Comprises business fixed investment and investment in inventories.
c. Consists of purchases of equipment, nonresidential structures, and intellectual property products.
d. Includes the construction of single-family and multifamily structures, manufactured homes, and dormitories; spending on home improvements; and brokers’ commissions and other ownership transfer costs.
e. Based on the national income and product accounts.
Consumer Spending. A large rise in net worth last year, strong income growth, and the diminution of social distancing this year support consumer spending. In CBO’s projections, spending is stronger than indicated by current incomes alone because households are likely to spend some of the funds they built up during the pandemic.7
Real consumer spending grows rapidly during 2021 in CBO’s projections, finishing the year 7.5 percent above its level in the fourth quarter of 2020. Sales of goods, which surged in the second half of 2020, continue to boom through the first half of 2021. As widespread vaccination facilitates a broader return to in-person service activities, expenditures on services lead the growth in consumer spending in the second half of the year—especially in areas where social distancing is still declining during that time. In the agency’s projections, consumer spending grows above trend again in 2022, by 3.3 percent. From 2023 to 2025, the projected growth rate averages 1.6 percent, a stronger pace than that of the economy as a whole.
The pace at which households will spend down elevated levels of savings is uncertain, but CBO estimates that it will be higher than standard estimates of spending out of wealth by typical asset holders in normal times. Very large liquid balances, such as deposits in checking or money market accounts, suggest that at least some households plan to spend a significant fraction of those savings over a relatively short horizon—perhaps within a few years. Households with higher income and those that invested in illiquid assets are less likely to spend in that way.
Business Investment. CBO expects real business fixed investment—the purchase of new equipment, nonresidential structures, and intellectual property products, such as software—to increase by 8.2 percent during 2021, reversing a 1.4 percent decline in 2020. That increase is expected to occur in response to a reversal of the sharp drop in demand during 2020 for the goods and services that businesses produce, as well as higher oil prices (which will boost investment in oil wells). Real investment in equipment and intellectual property products is forecast to grow more rapidly than investment in nonresidential structures. Further improvement in demand for businesses’ output is expected to boost real business fixed investment by an average of 2.4 percent per year from 2022 to 2025.
CBO projects that inventory investment will add significantly to the growth of GDP in 2021, measured from fourth quarter to fourth quarter. A combination of surging demand for goods and shortages of certain commodities, notably semiconductors, and labor caused the ratio of inventories to sales to fall in March to its lowest level in nearly nine years. As a result, although final sales of goods rose at a 20.1 percent annual rate in the first quarter, production of goods rose at only a 10.2 percent rate. CBO expects shortages to ease in the second half of 2021, allowing businesses to rebuild inventories to a level more commensurate with sales. Inventory investment is then expected to slow to a more sustainable pace from 2022 to 2025.
Residential Investment. After increasing by 14.3 percent in 2020 because of low mortgage rates, households’ desire for more and updated living space, and a dearth of existing homes for sale, real residential investment will increase by 5.0 percent during 2021, CBO projects. The agency expects real residential investment to decline by 1.9 percent per year from 2022 to 2025, on average, as mortgage rates rise by nearly 1 percentage point over that period and increased supply reduces the imbalance between supply and demand.
A combination of rising demand for homes and limited inventory of existing homes for sale caused house prices (as measured by the Federal Housing Finance Agency’s price index for home purchases) to increase by 10.8 percent in 2020. With demand remaining strong, CBO expects prices to rise by another 5.8 percent in 2021. New home prices are also rising rapidly because of strong demand as well as shortages of lumber and construction workers. As new supply comes on the market, price growth will slow to an average of 3.5 percent from 2022 to 2025, in CBO’s estimation.
Government Purchases. Real government purchases of goods and services—such as public educational services, highways, and military equipment—fell by 0.5 percent in 2020, as state and local governments reduced their purchases because of school closures and pandemic-related pressures on their fiscal year 2020 budgets (many of which ran through June 2020). CBO projects that, if current laws governing federal taxes and spending generally remain in place, real purchases by federal, state, and local governments will increase by 3.2 percent in 2021, boosted by recently enacted legislation, strong state and local tax receipts, and the reopening of schools. Real government purchases are projected to grow by an average of 0.4 percent per year from 2022 to 2025. In particular, real state and local government purchases are projected to grow by an average of 0.8 percent per year from 2022 to 2025, as the federal fiscal support to state and local governments is spent over a prolonged period and as economic activity further bolsters state and local tax revenues. Real federal government purchases, however, are projected to contract by an average of 0.3 percent per year over that same period, as federal spending related to the public health emergency wanes.
Exports and Imports. CBO projects that the U.S. trade deficit will shrink gradually between the middle of 2021 and 2025 after expanding substantially during the first half of 2021. Since the middle of 2020, the recovery in trade flows has been uneven, as growth in imports outpaced exports and, in turn, the trade deficit widened to its largest level since 2008. The recent robust growth in imports is attributable mostly to strong domestic demand for goods that has outpaced domestic supply. By contrast, a more gradual rebound in foreign demand for U.S. goods and services has led to a weaker recovery in U.S. exports. That trend will reverse, CBO projects, starting in the middle of 2021 as exports rise by 15.7 percent (at an annualized rate) but imports rise only by 8.0 percent over the second half of the year. As a result, the trade deficit is projected to shrink from 4.1 percent of GDP in the middle of 2021 to 2.9 percent of GDP in early 2025 (compared with 2.8 percent of GDP in 2019) as export growth continues to rise, driven by the recovery in services trade.
Exports. Real exports are expected to continue to rebound in 2021, rising by 9.5 percent. One factor contributing to that rebound in export growth is the improvement of economic conditions abroad, which boosts international demand for U.S. goods and services. CBO projects that the economic output of major U.S. trading partners will rise by 5.0 percent in 2021 after contracting by 2.5 percent in 2020. In addition, as the global effects of the pandemic continue to wane and international travel restrictions are lifted, exports of services (mostly travel and transportation) are expected to begin to recover after declining by 24 percent in 2020 and remaining weak in early 2021. CBO expects real exports of services to begin a gradual recovery in the second half of 2021 before returning to their prepandemic level by early 2023. Exports of capital goods are also expected to strengthen in 2021, reflecting a resumption in deliveries of Boeing 737 MAX aircraft. As exports of services return to prepandemic levels and the pace of foreign growth returns to its prepandemic trend, export growth is projected to rise slightly in 2022 before slowing in later years.
Imports. CBO projects that strong domestic demand for goods and services in 2021 will result in robust growth of real imports, which are expected to rise by 8.5 percent this year. That growth in imports is driven primarily by a 6.6 percent increase in imported consumer goods and industrial supplies. As with exports of services, CBO projects that, after falling by 24 percent in 2020, imports of services will rebound gradually in the middle of 2021 as international travel restrictions are lifted and return to their prepandemic level by the end of 2022. CBO projects that the growth rate of real imports will decline in 2022 and later years as growth in domestic demand slows.
Value of the Dollar. After falling by 6.7 percent over the second half of 2020, the international exchange value of the dollar is projected to decline by 2.4 percent in 2021 before stabilizing in later years. CBO projects that the dollar will weaken in 2021 as a result of the improved global economic outlook, which boosts expected returns on foreign investments and decreases demand for dollar-denominated assets relative to foreign assets in other currencies. Beyond 2021, CBO’s projection of a stable dollar reflects the agency’s expectation that changes in economic performance and monetary policies will lead the value of the dollar to appreciate against advanced-economy currencies but depreciate against emerging-market currencies in a way that is roughly offsetting.
Potential Output and the Output Gap
CBO’s projections of potential output are based on its projections of trends in underlying factors—such as the size of the labor force, the average number of labor hours per worker, capital investment, and productivity—and take into account the effects of federal tax and spending policies embodied in current law. (The pandemic has added uncertainty to those projections, as discussed below.)
Over the 2021–2025 period, potential output is projected to grow at an average annual rate of 2.0 percent, driven by the nearly 0.4 percent annual growth of the potential labor force and 1.6 percent annual growth of potential labor force productivity (see Table 2-3). That rate is stronger than the average rate over the past business cycle, in spite of slower growth of the potential labor force; the acceleration reflects CBO’s projection of a resurgence in investment in the aftermath of the pandemic-induced recession, as well as its assessment that trend growth in potential labor force productivity has accelerated modestly in recent years.
Table 2-3.
Key Inputs in CBO’s Projections of Real Potential GDP
Percent

Data source: Congressional Budget Office. See www.cbo.gov/publication/57263#data.
Real values are nominal values that have been adjusted to remove the effects of changes in prices. Potential GDP is CBO’s estimate of the maximum sustainable output of the economy.
The table shows compound annual growth rates over the specified periods. Those rates are calculated from the fourth quarter of the year immediately preceding each period to the fourth quarter at the end of that period.
GDP = gross domestic product.
a. The ratio of potential GDP to the potential labor force.
b. The flow of services, provided by the stock of capital goods (such as computers and other equipment), that constitute the actual input in the production process.
c. The average real output per unit of combined labor and capital services, excluding the effects of business cycles.
d. The ratio of potential output to potential hours worked in the nonfarm business sector.
Potential output in the nonfarm business sector, which is responsible for about three-quarters of aggregate economic activity and for nearly all productivity growth, is projected to grow at an average rate of 2.3 percent, substantially more rapidly than overall potential output. About 1.1 percentage points of that growth are attributable to potential total factor productivity in the sector (the source of most of the acceleration in overall potential productivity), about 0.9 percentage points are attributable to capital services (that is, the flow of productive services provided by the available stock of capital), and the remaining 0.3 percentage points are attributable to growth of potential hours worked.
In CBO’s projections, the output gap—the difference between actual output and potential output—closes rapidly, from an estimated average of −4.9 percent in 2020 to zero in mid-2021, and then becomes positive (that is, actual output exceeds potential output) during the rest of the year. Over the entire 2021–2025 period, the gap averages about 1.0 percent.
Potential GDP is an estimate of the economy’s maximum sustainable level of production rather than a strict constraint. That level corresponds to a high rate of use of labor and capital. Sustainability is a key part of that definition: CBO estimates that actual output can exceed potential for a short time and have only minimal effects on inflation. However, an extended period of time with a positive output gap will lead to upward pressure on wages and prices, triggering monetary authorities to take steps to slow the economy, such as by dampening the growth of credit. In response, the growth of output is likely to slow, bringing it closer in line with potential and closing the output gap.
The Labor Market
The labor market is expected to continue its recovery through the end of 2021 and into 2022. That pattern reflects the ongoing expansion of the economy as well as the easing of constraints associated with the pandemic and social distancing. Notably, the percentage of the population with immunity to the virus (whether through infection or vaccination) is expected to gradually increase. In CBO’s current projections, through the middle of 2022, the number of people employed returns to its prepandemic level, the unemployment rate continues to decline, the civilian labor force returns to its prepandemic size, and wage and salary growth rises (see Figure 2-3). Thereafter, through 2026, the projections reflect the labor market’s gradual return to its long-run average relationship to potential performance, with employment growth slowing, the unemployment rate rising gradually, and wage growth moderating.
Figure 2-3.
Employment, Unemployment, Labor Force Participation, and Wage Growth

In CBO’s projections, payroll employment reaches its prepandemic level in early 2022.
The unemployment rate is projected to decline through the remainder of 2021 and the first half of 2022 before returning to its long-term relationship with the noncyclical rate of unemployment.
The labor force participation rate is expected to rise from its current level through the end of 2022. The participation rate then remains close to that level for about two years as the effects of the continued economic recovery and the aging of the population offset each other.
In CBO’s projections, wage growth is projected to average 3.4 percent per year for the 2021–2025 period.
Data sources: Congressional Budget Office; Bureau of Labor Statistics. See www.cbo.gov/publication/57263#data.
Nonfarm payroll workers, who are employed in the private and public sectors, can include employees of nonprofit organizations and proprietors but by definition exclude farm workers.
The unemployment rate is the number of people not working who are available for work and are either seeking work or expecting to be recalled from a temporary layoff, expressed as a percentage of the labor force. The noncyclical rate of unemployment is the rate that results from all sources except fluctuations in aggregate demand, including normal turnover of jobs and mismatches between the skills of available workers and the skills necessary to fill vacant positions.
The labor force participation rate is the share of the civilian noninstitutionalized population age 16 or older that has jobs or that is available for and actively seeking work. The potential labor force participation rate is CBO’s estimate of the rate that would occur if economic output and other key variables were at their maximum sustainable amounts.
Wages are measured using the employment cost index for wages and salaries of workers in private industry. Growth in wages is measured as average annual growth. For the unemployment rate and labor force participation rate, data are annual averages.
Employment. Growth of payroll employment is projected to continue at a relatively rapid pace through the end of 2021 and into the first half of 2022. In CBO’s current projections, nonfarm payroll employment rises by an average of 587,000 jobs per month in 2021 and by an average of 417,000 jobs per month in 2022. At those rates, nonfarm payroll employment is projected to reach its prepandemic level by the middle of 2022 and its estimated potential at about the same time. After 2022, payroll jobs gains are projected to slow to less than 30,000 per month, on average, as the economy and labor markets grow at lower trend rates. Reflecting the increases in employment and a rise in the labor force participation rate, the employment-to-population ratio largely recovers to a level near its prepandemic peak by the end of 2022. Subsequently, the employment-to-population ratio initially flattens out before gradually declining through the remainder of the projection period.
Unemployment. The unemployment rate and the number of unemployed people are projected to decline gradually through the remainder of 2021 and through the first half of 2022, reflecting the continued growth of the economy. In CBO’s projections, the overall unemployment rate falls from 5.8 percent in the second quarter of 2021 to 4.6 percent by late 2021. The number of unemployed people falls to 7.5 million by the end of 2021 and to 6.0 million by the end of 2022. The unemployment rate is projected to fall below the noncyclical rate of unemployment in early 2022 and to reach 3.6 percent by the end of 2022.8
Labor Force Participation. The labor force participation rate is expected to rise gradually from its current level through the end of 2022. In CBO’s current projections, the labor force participation rate rises from 61.8 percent in the second quarter of 2021 to 62.2 percent by the end of the year and then continues to rise, reaching 63.0 percent in early 2023, near its prepandemic peak of 63.4 percent. Thereafter, it gradually declines as the effects of the aging of the population (which dampens the overall labor force participation rate) become more prominent relative to the short-term effects of the expanding economy.
Hourly Wages and Salaries. The ongoing gains in the labor market and the stronger performance of the economy are expected to put upward pressure on wage growth. In CBO’s projections, the employment cost index for wages and salaries of workers in private industry—a measure of the hourly price of labor—is 3.7 percent higher in the fourth quarter of 2021 than it was in the fourth quarter of 2020; its annual growth rate in recent years (and before the pandemic began) was about 3 percent. Stronger wage growth is projected to continue, averaging 3.5 percent per year for the 2021–2025 period.
Inflation and Interest Rates
CBO expects inflation to increase in 2021, as a variety of factors cause supply to grow more slowly than demand in both product markets and labor markets, before falling in 2022. After 2022, the agency projects that the rate of inflation will slightly exceed the Federal Reserve’s 2 percent long-run goal for inflation for several years. The agency expects short-term interest rates to remain low over the next few years but then rise beginning in the second half of 2023. Long-term interest rates, which have increased since earlier this year, are expected to rise slightly through 2023. CBO expects both short- and long-term interest rates to rise more rapidly after 2023.
Inflation. In CBO’s projections, inflation rises in 2021, as the economy recovers from the pandemic-induced recession (see Figure 2-4, top panel). The growth rate of the PCE price index—the measure the Federal Reserve uses to define its 2 percent long-run goal for inflation—was 1.2 percent in 2020, well below that goal. CBO projects that the rate will increase to 2.8 percent in 2021. The traditional measure of core PCE price inflation, which excludes food and energy prices because they tend to be volatile, is projected to rise from 1.4 percent in 2020 to 2.4 percent in 2021.
Figure 2-4.
Inflation and Interest Rates

In CBO’s projections, inflation rises in 2021 as the economic expansion continues. It then declines in early 2022 before rising again in 2023 and remaining elevated for several years.
The 3-month Treasury bill rate remains near zero through early 2023 and then gradually rises as the Federal Reserve begins raising the federal funds rate in the second half of 2023. The interest rate on 10-year Treasury notes is expected to increase through 2023 but at a slower pace than in the first few months of 2021.
Data sources: Congressional Budget Office; Bureau of Economic Analysis; Federal Reserve. See www.cbo.gov/publication/57263#data.
The inflation rate is based on the price index for personal consumption expenditures; the core rate excludes prices for food and energy.
Inflation is measured from the fourth quarter of one calendar year to the fourth quarter of the next.
The federal funds rate is the interest rate that financial institutions charge each other for overnight loans of their monetary reserves.
PCE = personal consumption expenditures.
Inflation declines in early 2022 before rising again over the following year and then remaining slightly above the Federal Reserve’s 2 percent long-run goal for several years, in CBO’s projections. The agency expects many of the current disruptions to the supply of goods and services—as well as many of the effects of recently enacted legislation on the demand for goods and services—to fade by the end of this year. CBO projects that, together, those developments will cause inflation to fall in the first half of 2022. After that, upward pressure on prices from strong labor and product market conditions dominates those factors, causing inflation to rise again. The core PCE price index is projected to grow by 2.0 percent in 2022, and the core consumer price index for urban consumers (CPI-U; core CPI-U excludes food and energy prices) is projected to grow by 2.4 percent in that same year. In 2023, CBO expects the core PCE price index to grow by 2.2 percent and the core CPI-U to grow by 2.5 percent. Those projected growth rates would put core inflation at its highest level in more than a decade. After 2023, the agency projects that inflation will remain above the Federal Reserve’s 2 percent long-run goal through 2025.
CBO has two main reasons for projecting only a modest increase in inflation over the next few years, even though output is above the maximum sustainable level of production. First, the agency estimates that the relationship between labor market slack and inflation is currently weak. Therefore, in CBO’s estimation, a substantial decrease in the unemployment rate—one that causes wage growth to increase—places only a small amount of upward pressure on overall consumer prices. Moreover, a substantial increase in the unemployment rate puts only a small amount of downward pressure on inflation, which implies that monetary policymakers could find it more challenging to reduce inflation if it becomes too high. The observed weakness of that relationship in recent history may result from the increased use of global supply chains for production, which decreases the importance of domestic labor market slack, or from higher profit margins, which allow businesses to more easily absorb wage increases without raising prices.
The second reason CBO projects a modest increase in inflation is that expectations about inflation are well anchored, or stable. In other words, a short-term increase in inflation is not expected to cause a substantial rise in expected future inflation, which could lead it to spiral upward. In the agency’s estimation, inflation expectations will remain well anchored, in part because of the Federal Reserve’s institutional credibility in keeping inflation stable over the past several decades.
Interest Rates. In CBO’s projections, the Federal Reserve keeps its target for the federal funds rate at 0.1 percent through the first half of 2023. It is expected to begin raising the target for the federal funds rate in the second half of 2023, roughly a year after inflation reaches and begins to exceed the Federal Reserve’s 2 percent long-run goal and the unemployment rate reaches a level consistent with stable long-run inflation. The Federal Reserve gradually raises rates after that point, allowing inflation to slightly exceed 2 percent for some time. The interest rate on 3-month Treasury bills typically follows the same pattern as the federal funds rate (see Figure 2-4, bottom panel). In CBO’s projections, the 3-month Treasury bill rate averages 0.1 percent through early 2023 and then gradually rises as the Federal Reserve begins raising the federal funds rate target in the second half of 2023.
Long-term interest rates are expected to increase through 2023 but at a slower pace than the increase in the first few months of 2021. Part of the reason for a somewhat muted increase in long-term interest rates is that current long-term rates are elevated because financial market participants probably expect additional fiscal policy initiatives beyond those already enacted. Because CBO’s forecast is based on current law, its projections incorporate an assumption that the effect of expected future policy that is embodied in current interest rates dissipates over time. CBO also expects the Federal Reserve’s purchases of Treasury and other securities to mute a rise in long-term interest rates through 2023. Starting in 2022, in CBO’s projections, the Federal Reserve’s net purchases of those securities gradually taper to zero by the first half of 2023. As that happens, long-term interest rates begin rising more quickly.
CBO projects that part of the increase in long-term interest rates through 2025 is also due to the expectation of rising short-term interest rates. The average of expected short-term interest rates is one of the factors driving movements in long-term interest rates. In CBO’s projections, the interest rate on 10-year Treasury notes rises from under 1.8 percent at the end of 2021 to 2.7 percent in 2025.
The Economic Outlook for 2026 to 2031
CBO’s projections of GDP, unemployment, inflation, and interest rates for the second half of the coming decade are based mainly on the agency’s projections of the underlying trends in the factors that determine those key variables—the size of the labor force, the average number of labor hours per worker, capital investment, and productivity—and take into account the effects of federal tax and spending policies embodied in current law. In some cases, those policies, as well as monetary policy, might be projected to influence not only the demand for goods and services—and, therefore, the gap between actual output and potential output—but also potential output itself. In addition, the pandemic might have longer-term effects on potential output that are not yet apparent in current data.
During the 2026–2031 period, in CBO’s projections, the economy continues to expand, and output exceeds potential output through early 2027. The agency expects monetary policy to become less accommodative over the period, slowing the growth of actual output. Over the 2026–2031 period, the annual growth of actual output averages 1.6 percent, slower than the 1.7 percent projected for the growth of potential output. That reduction in economic growth brings actual output back to its long-term relationship with potential output in 2030. The output gap becomes negative, averaging −0.2 percent over the period and reaching −0.5 percent in 2030 and 2031.
Growth of consumer spending slows to an average of 1.9 percent over the period. The unemployment rate drifts up to about 4.5 percent at the close of the period. PCE price inflation remains at about 2.1 percent for the first three years of the period before declining to the Federal Reserve’s long-run goal of 2.0 percent by 2029. Interest rates continue to rise gradually throughout the 2026–2031 period: The federal funds rate rises from 1.4 percent in 2026 to 2.6 percent in 2031, the 3-month Treasury rate rises from 1.4 percent to 2.5 percent, and the 10-year Treasury note rate rises from 2.9 percent to 3.5 percent.
Actual Output and Potential Output
Although changes in the overall demand for goods and services strongly influence CBO’s economic projections during the first half of the period covered in this report, the agency’s projections for the second half of the period are fundamentally determined by its assessment of the prospects for growth of key inputs: the potential number of workers in the labor force, capital services, and the potential productivity of those factors.
In CBO’s projections, growth of potential output over the 2026–2031 period averages 1.7 percent per year, a rate roughly equal to the average during the most recent business cycle (see Table 2-3). That annual growth is driven by average annual growth of about 0.3 percent in the potential labor force and of about 1.4 percent in potential labor force productivity (see Figure 2-5). Potential output in the nonfarm business sector grows at an average rate of 2.0 percent. About 1.1 percentage points of that growth are attributable to growth of potential total factor productivity in the sector; about 0.7 percentage points are attributable to growth of capital services; and the remaining 0.2 percentage points are attributable to growth of potential hours worked. The output gap gradually decreases from just above zero in 2026 to −0.5 percent in 2031.
Figure 2-5.
Composition of the Growth of Real Potential GDP
Percentage Change

Over the next five years, real potential GDP is projected to grow faster than it has since the 2007–2009 recession because of faster growth in potential labor force productivity. However, growth in the potential labor force is projected to be slower than in previous periods, largely because of the aging of the population.
Data source: Congressional Budget Office. See www.cbo.gov/publication/57263#data.
Real values are nominal values that have been adjusted to remove the effects of changes in prices. Growth in real potential GDP is the sum of growth in the potential labor force and growth in potential labor force productivity. The potential labor force is CBO’s estimate of the size of the labor force that would occur if economic output and other key variables were at their maximum sustainable amounts. Potential labor force productivity is the ratio of real potential GDP to the potential labor force.
The bars show average annual growth rates over the specified periods, calculated using calendar year data.
GDP = gross domestic product.
Although trends in potential employment and hours worked are driven mainly by underlying trends in the potential labor force in CBO’s projections, the growth of potential hours worked is further influenced by certain temporary provisions of major tax legislation enacted in 2017. The agency estimates that those provisions induced an increase in potential hours worked beginning in 2018 and will also lead to a decrease in potential hours worked after the provisions expire (under current law) at the end of 2025.
The Labor Market
CBO’s projections of employment, labor compensation per hour, unemployment, and labor force participation over the 2026–2031 period primarily reflect the agency’s assessment of the overall performance of the economy and the effects of long-term demographic trends, which will strongly influence the size and composition of the workforce in the coming decades.
The growth in employment and labor compensation per hour is projected to moderate over the 2026–2031 period relative to the first five years of the projection period. Nonfarm payroll employment increases by an average of about 42,000 jobs per month during those years, in CBO’s projections. Real compensation per hour in the nonfarm business sector, a measure of labor costs that is a useful gauge of longer-term trends, grows at an average annual rate of 1.6 percent over the 2026–2031 period—close to the projected average growth in labor productivity in that sector.
CBO expects the noncyclical rate of unemployment to decline slowly over the next decade, from 4.5 percent in 2020 to 4.3 percent by 2031. That decline reflects the continuing shift in the composition of the workforce toward older workers, who tend to have lower rates of unemployment (when they participate in the labor force), and away from less educated workers, who tend to have higher ones.
CBO expects the labor force participation rate to fall during the second half of the 11-year projection period. Specifically, the overall labor force participation rate is projected to fall from 61.9 percent at the beginning of 2026 to 60.8 percent by the end of 2031. That decline is mostly driven by the aging of the population and, in particular, the continued retirement of baby boomers. That rate in 2031 is close to the agency’s estimate of the potential labor force participation rate, which falls from 62.8 percent in 2020 to 61.6 percent in 2026 and to 60.9 percent in 2031.
Inflation and Interest Rates
CBO expects strong labor and product market conditions to continue to put upward pressure on prices, supporting inflation that is above the agency’s projected long-run average level for several years. Toward the end of the 11-year projection period, as real GDP falls below the maximum sustainable level of production and the rate of use of labor declines, inflation decreases toward its projected long-run average level. The agency expects interest rates to continue rising in the later years of the projection period as the Federal Reserve continues removing accommodation by raising short-term interest rates and reducing its holdings of Treasury and other securities. CBO also expects interest rates to rise in response to rising debt relative to GDP.
Inflation. In CBO’s projections, as strong labor and product market conditions persist, inflation remains above its projected long-run average level before falling back down toward that level near the end of the projection period. The agency expects the growth rate of the PCE price index to modestly exceed 2.0 percent, the Federal Reserve’s long-run goal for inflation, for several years before returning to that level. CPI-U inflation is projected to rise to 2.5 percent in 2026 before falling to 2.3 percent.
Interest Rates and Federal Reserve Policy. CBO expects short- and long-term interest rates to rise over the 2026–2031 period but remain below their historical average. Rising federal debt in relation to GDP, a reduction in the Federal Reserve’s holdings of Treasury securities, a decline in the share of Treasury securities held by foreign investors, and a gradual decrease in the premium paid on risky assets are expected to exert upward pressure on short- and long-term interest rates. Nevertheless, projected interest rates remain below their average over the past four decades for several reasons, including lower average expected inflation, slower growth of the labor force, and slower growth of productivity.9
In CBO’s projections, the Federal Reserve raises the target for the federal funds rate through 2031, and the pace of rate hikes is gradual enough to allow inflation to remain above 2 percent through the end of 2028. Under the Federal Reserve’s revised monetary policy strategy, inflation exceeds 2 percent following periods when inflation has fallen short of that rate in order to achieve 2 percent average inflation over time.10 In addition, in CBO’s projections, the Federal Reserve slows the pace of rate hikes in 2026 in response to the expiration of some of the tax reductions that were enacted in the 2017 tax act.
The 3-month Treasury bill rate is expected to rise along with hikes in the federal funds rate. CBO expects the interest rate on 10-year Treasury notes to rise as the Federal Reserve reduces its holdings of long-term securities and as rising debt relative to GDP begins to put upward pressure on interest rates. In CBO’s projections, the average federal funds rate increases from 1.4 percent in 2026 to 2.6 percent in 2031. Similarly, the rates for 3-month Treasury bills and 10-year Treasury notes are expected to rise from 1.3 percent to 2.4 percent and from 2.8 percent to 3.5 percent, respectively, over that period.
Projections of Income for 2021 to 2031
Economic activity and federal tax revenues depend not only on the amount of total income in the economy but also on how that income is divided among labor income, domestic profits, proprietors’ income, income from interest and dividends, and other categories. (Labor income includes wage and salary payments as well as other forms of compensation, such as employer-paid benefits and the part of proprietors’ income corresponding to compensation for hours worked.) The shares for wages and salaries and for domestic profits are particularly important in projecting federal revenues because those types of income are taxed at higher rates than others.
Labor Income
Compensation of employees fell by less than the income of business owners in the pandemic-induced recession of 2020; as a result, labor’s share of national income rose sharply in that year. CBO projects that labor’s share of income will fall back toward prepandemic levels during 2021 and settle at 57.6 percent in 2022. In CBO’s projections, strong demand for goods and services drives further gains in employment and compensation, resulting in a modest uptick in labor’s share after 2022.
Wages and salaries as a share of GDP average 43.6 percent over the projection period. CBO projects that the share will fall early in the period, even though wages and salaries grow by 8.3 percent in 2021 and 4.9 percent in 2022. In CBO’s projections, the share of those incomes slips back to 43.3 percent of GDP in 2022. Subsequently, the share of wages and salaries gradually rises back to 43.8 percent of GDP by 2028.
In CBO’s projections for the 2021–2031 period, labor income as a share of GDP averages 58.1 percent. In the aftermath of the recession, labor’s share initially falls to 57.6 percent but then rises over time to reach 58.4 percent by 2029. That increase is consistent with CBO’s projection of labor market variables, such as hours worked and compensation per hour. However, labor’s share remains below 60.8 percent, its long-run average over the 1947–2000 period.
Corporate Profits and Business Income
The large federal subsidies that continue to flow to businesses in 2021 as part of pandemic-related support will boost employees’ compensation, proprietors’ incomes, and corporate profits. In CBO’s estimation, about 60 percent of pandemic-related business subsidies flowed into corporate profits during 2020, a smaller share flowed into increased employee compensation, and the smallest share went into proprietors’ incomes. During 2021, expanded or extended subsidies to businesses will boost corporate profits as they did in 2020, but the share flowing into compensation will be smaller than the share flowing to proprietors.
In CBO’s projections, domestic corporate profits amount to a larger share of GDP over the 11-year projection period than they did in the 40 years before the pandemic. Domestic corporate profits averaged 7.6 percent of GDP from 1980 to the end of 2019. At the onset of the pandemic, domestic corporate profits fell to 7.2 percent of GDP in the first quarter of 2020, but they rebound to above 10 percent in CBO’s projections for the second half of 2021. The agency expects the domestic profit share to fall back toward 8 percent by 2028, as increased borrowing and a steady upward rise in market interest rates combine to raise interest payments.
Uncertainty in the Economic Outlook
An unusually high degree of uncertainty surrounds CBO’s latest economic projections. The agency’s projections of inflation are highly uncertain, both in the short term—when the upward pressure on prices from supply shortages and strong demand for labor could be larger or smaller than expected—and in the longer term, when the path of expected inflation could be higher or lower than expected. Uncertainty also surrounds the path of the pandemic and the recovery from the recent downturn, both domestically and internationally. The impact of recent fiscal and monetary policies is highly uncertain, as are the stability of financial markets and the path of the recovery in the labor market. The pace of potential output is a significant longer-term uncertainty, as is the impact of the pandemic on the key inputs to that potential output growth.
CBO’s baseline projections incorporate the assumption that current laws governing federal taxes and spending generally remain in place and that no significant additional funding or aid is provided. Although new laws could be enacted that significantly alter federal taxes and spending, that possibility does not add to the uncertainty surrounding the agency’s baseline projections, so this discussion is restricted to uncertainty stemming from other sources.
Inflation
A high degree of uncertainty surrounds CBO’s inflation projections in the short term. One source of uncertainty is that businesses may face pandemic-related difficulties—such as acquiring supplies or hiring workers—that make them less able to rapidly increase production to meet the surging demand for goods or services, which could result in higher inflation than CBO projects. Likewise, businesses, in response to strong incentives, may soon overcome a variety of supply disruptions, which could result in lower inflation than CBO projects.
Another source of inflationary pressures arises from historically low levels of labor market slack in the agency’s projections. CBO’s estimates of the inflationary pressure caused by decreasing amounts of labor market slack are informed by the correlation between that slack and inflation since the late 1990s. Those estimated effects are uncertain, however, and few periods over the past 50 years have had less labor market slack than the agency projects over the next few years, making historical comparison more difficult.
Finally, for the longer term, CBO’s inflation projections depend on inflation expectations, which are not very responsive to changes in actual inflation, in the agency’s estimation. The agency expects that, for the most part, consumers and businesses will view recent price increases as transitory and as having little effect on future inflation. However, if price increases become more widespread and prove longer lasting, then inflation expectations could rise more materially, and inflation would be higher than CBO projects. Alternatively, if actual inflation turns out to be below expected inflation over the next several years, expected future inflation could be lower.
The Pandemic and the Recovery
The severity and duration of the pandemic, both domestically and abroad, are subject to significant uncertainty, as are its effects on economic activity. In particular, great uncertainty remains about how quickly future outbreaks can be brought under control where immunity to the virus remains limited, as well as the extent to which those outbreaks will restrain economic activity. Uncertainties remain about the extent of vaccination in harder-to-reach communities and the extent to which people will accept vaccination when it is accessible.
Further uncertainty surrounds the pace at which consumers and businesses will regain their financial stability and return to longer-term spending trends. The pace of economic expansion could be faster or slower than CBO projects. On the one hand, buoyed by excess savings and a desire to reengage in travel and other recreational activities that were heavily restricted earlier in the pandemic, consumer spending might grow more rapidly than the agency expects. On the other hand, consumers may not be as quick to return to their prepandemic spending habits, or businesses may face more significant headwinds to increasing their production than the agency expects. Considerable uncertainty also surrounds the rates at which landlords will default on their mortgages, or renters will file for bankruptcy protections, following the expiration of various rent or eviction moratoriums and other types of loan forbearance.
Policy Responses to the Pandemic
CBO’s estimates of the economic effects of recently enacted legislation are subject to considerable uncertainty. Some important sources of that uncertainty are how consumers and businesses may respond to various policy changes included in the legislation; how the timing, scale, and breadth of the legislation may affect consumers’ and businesses’ confidence; how responses to policy changes may be altered by the pandemic and social distancing; what the course of the pandemic may be; how rapidly social distancing may be relaxed; and what fraction of the population may ultimately be vaccinated. CBO’s estimates of the economic effects of recently enacted legislation represent the middle of the range of potential outcomes.
The path of monetary policy is uncertain as well. The Federal Reserve recently adopted a flexible average inflation target, indicating that it expects to allow inflation to rise above 2 percent for some period of time following periods when inflation falls below 2 percent.11 Because the policy is new, it is uncertain how it will be implemented in practice, which contributes to uncertainty about the path of short-term interest rates. Uncertainty also surrounds the Federal Reserve’s policy of purchasing Treasury and other securities. In early 2020, the Federal Reserve began purchasing them in large quantities to stabilize financial markets and reduce long-term interest rates. It has not yet indicated when it expects those purchases to be discontinued, which contributes to uncertainty about the path of longer-term interest rates.
Uncertainty about monetary policy contributes to uncertainty about interest rates. Other factors contribute to that uncertainty as well, including uncertainty about the pandemic and the near-term pace of growth in the U.S. and global economies. Factors such as increased foreign and domestic saving, slower total factor productivity growth, and lower labor force participation have contributed to the downward trend in interest rates over the past several decades. Much uncertainty remains about the extent to which those factors will continue to weigh on interest rates over the next several years. In addition, the extent and timing of upward pressure on interest rates stemming from increased federal borrowing is highly uncertain.
The Financial Sector and Asset Prices
Two additional sources of uncertainty about the forecast are the financial sector and asset prices. After the Federal Reserve’s intervention in markets in 2020 because of COVID-19, the disease caused by the coronavirus, financial conditions have been stable in the first half of 2021, and the banking system is well capitalized. Nevertheless, the potential for a sharp decline in asset prices represents a significant downward risk to the forecast.
Because of low inflation and low risk-free interest rates, investors have had a heightened demand for any asset that might produce higher returns, including equity, corporate bonds, leveraged financial products, and volatile cryptocurrencies. That demand has led to high equity valuations, relative to GDP, and an increase in corporate debt in both investment grade and speculative grade categories. Those developments could lead to a sharp decrease in asset prices if investors’ appetite for risk quickly changes. Moreover, spending on housing has grown rapidly over the past year, and inventories have decreased over that period, leading to a large increase in home prices. A sudden drop in asset values or an abrupt rise in mortgage interest rates could cause spending on housing to stall, despite the large fiscal stimulus.
The Labor Market
The uncertainty surrounding the labor market’s recovery in the near term is particularly high, reflecting uncertainty about the future course of the pandemic, the pace of economic recovery and expansion, and the state of various government policies supporting households, workers, and businesses. If, for example, labor force participation rates rise less or consumer demand increases less than CBO currently expects, then the labor market’s overall recovery will be slower than in CBO’s current projections. However, if the economy returns to prepandemic patterns and interactions faster than CBO currently projects, then the labor force participation rate and labor markets overall could rebound more strongly than projected.
Moreover, the rapid adaptation to remote work by existing businesses and households may be creating many opportunities for new businesses, creating new jobs, and spurring sectoral and geographic reallocations that can help improve both productivity and social and economic welfare. If, for example, business formation and job creation in evolving and more quickly expanding parts of the economy are greater than CBO currently expects, then labor market recovery could be faster and stronger than in CBO’s current projections. At the same time, uncertainty exists about how such dynamic forces and relationships could result in the destruction of existing businesses and business models, as well as about the negative consequences for output and labor markets.
Furthermore, the severity and the duration of economic weakness over the past year may influence the extent to which various types of workers experience negative long-term labor market outcomes—including reduced future employment rates and earnings. Workers who are particularly vulnerable to negative labor market outcomes, which could last a decade or more, include those who experience long spells of unemployment, young people who enter the labor market in a weak economy, and women, who have disproportionally dropped out of the labor force to provide child care and other care at home during the pandemic. Students whose schooling has been disrupted during the pandemic could face long-term negative consequences, and the potential harm is skewed toward those who have already been most disadvantaged. For many students graduating from school during the pandemic, the recession and social distancing made it much more difficult to gain work experience that would benefit them in the future. Finally, long-term health risks—including potential long-term effects of COVID-19 infections, exacerbation of the opioid crisis by the pandemic, and the toll on people’s mental health—could influence the prospects of many workers as well as the strength of the overall labor market.
Long-Term Growth
CBO’s longer-run projections reflect the additional uncertainty in underlying trends of key variables, such as the size of the potential labor force, the average number of labor hours per worker, capital investment, and productivity. Particularly uncertain for CBO’s analysis are the long-run effects of the pandemic on growth of potential total factor productivity in nonfarm businesses. The pandemic sped the adoption of new technologies, such as teleconferencing and telemedicine, but the effects of more rapid adoption on productivity remain unknown. Innovations associated with working from home could lead to substantial reductions in costs and improvements in productivity. Conversely, disruptions to the education system could have lasting effects on the future productivity of workers. Long-term growth could also be influenced by the disparate effects the pandemic has had on different industries and groups of people. Persistent and substantial positive or negative effects of the pandemic on productivity could influence underlying trends in ways that are as yet unmeasured.
A further source of long-term uncertainty is the global economy’s longer-term response to the substantial increases in public deficits and debt that are occurring as governments spend significant amounts to attempt to mitigate the impact of the pandemic and the economic downturn. Broad increases in debt linkages among countries (including their national governments, financial institutions, and other entities) can raise the risk that financial stress in any one country will affect the financial stability of other countries.
Quantifying the Uncertainty in CBO’s Projections
CBO estimates that there is approximately a two-thirds chance that the rate of real GDP growth (on a calendar year basis) will be between 5.3 percent and 8.1 percent in 2021 and between −1.0 percent and 3.5 percent in 2025 (see Figure 2-6). Those ranges are based on historical differences between CBO’s past forecasts and actual outcomes and on the agency’s assessment that the distribution of future differences is likely to be similar to that of past differences. Some of those historical differences are associated with turning points in the business cycle, which are difficult to anticipate.12 In addition, CBO expects that there is a two-thirds chance that the average annual rate of real GDP growth will be between 1.8 percent and 4.4 percent over the next five years. That range is smaller than the ranges for the year-by-year rates of growth because the forecast error for the average annual rate of growth over five years is approximately the average of the year-by-year forecast errors over a five-year period, and some of those errors are offsetting.
Figure 2-6.
Uncertainty in CBO’s Projections of Real GDP Growth and Inflation
Percent

CBO estimates that—if the errors in the agency’s current economic forecast are similar to those in its previous forecasts—there is approximately a two-thirds chance that the annual rate of real GDP growth will be between 5.3 percent and 8.1 percent in 2021. The agency estimates that range to be between −1.0 percent and 3.5 percent in 2025.
Also, there is approximately a two-thirds chance that the annual growth in consumer prices will be between 2.3 percent and 4.3 percent in 2021. CBO estimates that range to be between 0.3 percent and 4.5 percent in 2025.
Data sources: Congressional Budget Office; Bureau of Economic Analysis; Federal Reserve. See www.cbo.gov/publication/57263#data.
Real values are nominal values that have been adjusted to remove the effects of changes in prices.
The shaded areas around CBO’s baseline projections of real GDP growth and consumer price inflation illustrate the uncertainty of those projections. The area is based on the root mean square of the forecast errors in CBO’s one-, two-, three-, four-, and five-year projections of the average annual growth rates of real GDP and consumer prices for calendar years 1976 through 2020.
Inflation of consumer prices is measured by the consumer price index for all urban consumers.
GDP = gross domestic product.
CBO’s past forecasts of inflation (as measured by the CPI-U) suggest that there is roughly a two-thirds chance that inflation will be between 2.3 percent and 4.3 percent in 2021 and between 0.3 percent and 4.5 percent in 2025. In addition, CBO expects that there is a two-thirds chance that the average annual rate of inflation will be between 1.1 percent and 4.0 percent over the next five years.
Comparison With CBO’s February 2021 Economic Projections
CBO’s current projections can be usefully compared with its most recent projections, from February 2021 (see Table 2-4). The comparison illuminates aspects of the current projections and highlights the kinds of uncertainty that affect all such projections.
Table 2-4.
CBO’s Current and Previous Economic Projections for Calendar Years 2021 to 2031

Data sources: Congressional Budget Office; Bureau of Labor Statistics; Federal Reserve. See www.cbo.gov/publication/57263#data.
GDP = gross domestic product; PCE = personal consumption expenditures; * = between zero and 0.05 percentage points.
a. Real values are nominal values that have been adjusted to remove the effects of changes in prices.
b. Excludes prices for food and energy.
c. The consumer price index for all urban consumers.
d. The employment cost index for wages and salaries of workers in private industry.
e. Adjusted to remove distortions in depreciation allowances caused by tax rules and to exclude the effects of changes in prices on the value of inventories.
Actual Output, Potential Output, and Income
The agency’s projection of real GDP growth for 2021 is much stronger than it was last winter. That revision results largely from three developments. First, significant additional fiscal aid has been enacted since the publication of the February 2021 forecast. Second, the effects of social distancing on economic activity in 2021 are projected to be somewhat weaker than CBO expected last winter, as immunity to the virus has become more widespread by mid-2021 than CBO had expected. Third, CBO raised its estimate of spending out of the additional savings that households accumulated during the pandemic.
Beyond 2021, the agency now expects the growth in real GDP in 2022 to be stronger than it did last winter, weaker through 2026, and similar thereafter. As a consequence, actual real GDP is projected to be substantially greater for much of the first half of the projection period than the agency expected in February and to remain greater throughout the entire period. The main source of more rapid growth is investment spending: The projection of real fixed investment in 2022 and 2023 is more than 4 percent larger than it was in February. The gains are strongest for business investment, but residential investment during 2022 is up more than 3 percent from the February projection as well.
The projected level of real consumer spending is more than 3 percent higher in 2021 through 2023 than in CBO’s February projection, and the average growth rate of real consumer spending from 2021 through 2025 is 0.2 percentage points higher. That upward revision is partly due to a significantly stronger projection of household income. Increased household support from the American Rescue Plan Act of 2021 contributes significantly to the income gains starting in March, and real compensation of employees also grows faster than previously projected. Another part of the upward revision to real consumer spending stems from a more rapid decline in social distancing, as consumers resumed economic activities more quickly than CBO had expected in February. In addition, CBO raised its estimate of spending out of the additional savings that households accumulated during the pandemic, recognizing that a significant share of that increased household saving flowed into liquid assets.
In terms of underlying trends that contribute to growth of potential output, by far the most important revisions to CBO’s projections since February are revisions to business investment and, to a lesser extent, residential investment. Stronger-than-expected investment of both types leads to larger service flows from a larger stock of capital, raising potential output compared with the February projection. In addition, the agency has increased its projections of productivity growth in the nonprofit and government sectors of the economy, in part reflecting recent historical trends. As a consequence of those revisions, real potential GDP remains about 1 percent larger than previously projected from 2024 through the end of the projection period.
In nominal terms, the agency’s projections of output and income are higher throughout the projection period, partly because projected price inflation is above the rates anticipated in February over the next several years. Nominal GDP is about 2.3 percent higher, and net national income is about 1.5 percent higher, at the end of the period than CBO projected last winter.
The Labor Market
CBO’s current projections for the labor market are stronger in the near term than the projections released in February, but they are not as strong for the second half of the projection period. Specifically, over the 2021–2025 period, the unemployment rate is projected to average 4.2 percent, about 0.6 percentage points lower than the 4.8 percent average projected in February. Over the 2026–2031 period, the average unemployment rate—4.4 percent—is about 0.3 percentage points higher than previously projected, because economic growth returns sooner to its long-run average relationship relative to its potential in the current projection than in February.
Inflation and Interest Rates
Inflation is projected to be higher in the 2021–2025 period than it was in February. That near-term revision results from a variety of factors, including those that heavily influenced the agency’s revisions to real GDP.
CBO now expects both short- and long-term interest rates over the coming decade to be slightly higher, on average, than in its previous forecast. The upward revision in rates over the 2021–2025 period partly reflects the upward revision to inflation and a faster recovery from the pandemic-induced recession. In addition, the agency now expects the Federal Reserve to begin raising rates in the second half of 2023—one year earlier than previously projected.
CBO raised its forecasts of both short- and long-term interest rates, on average, over the later years of the projection period as well. The earlier date for the start of rate hikes means that short-term rates are projected to be higher, on average, over the 2026–2031 period than the agency expected in February. It also means that long-term rates, which partly reflect the expected path of short-term rates, will be higher, on average.
Comparison With Other Economic Projections
For the most part, CBO’s projections of the economy for 2021 and 2022 are comparable to those of the consensus (that is, the average) of the forecasts of about 50 private-sector economists that were published in the July 2021 Blue Chip Economic Indicators (see Figure 2-7).13 CBO’s projection of real GDP growth for 2021 is close to the consensus and is within the middle two-thirds of the range of Blue Chip forecasts. CBO’s projection of real GDP growth for 2022 is more favorable than the Blue Chip consensus and is near the top of the middle two-thirds of the range. The agency’s projections of the unemployment rate for 2021 and 2022 are more favorable than the Blue Chip consensus and are near or below the middle two-thirds. For inflation both in GDP prices and in consumer prices (as measured by the CPI-U), CBO’s projections are lower than the Blue Chip consensus for 2021 and 2022 and are near or below the bottom of the middle two-thirds. The agency’s projections of the interest rates on 3-month Treasury bills and 10-year Treasury notes are within the middle two-thirds of the range of Blue Chip forecasts for 2021. For 2022, CBO’s projection for the 3-month Treasury bill is approximately at the lower end of the middle two-thirds, and the agency’s projection for the 10-year Treasury note is lower than the consensus and near the bottom of the middle two-thirds.
Figure 2-7.
Comparing CBO’s Forecasts With Those of the Blue Chip Forecasters
Percent

Data sources: Congressional Budget Office; Wolters Kluwer, Blue Chip Economic Indicators, vol. 46, no. 7 (July 12, 2021). See www.cbo.gov/publication/57263#data.
The full range of forecasts from the Blue Chip survey is based on the highest and lowest of the roughly 50 forecasts. The middle two-thirds of that range omits the top one-sixth and the bottom one-sixth of the forecasts.
Real values are nominal values that have been adjusted to remove the effects of changes in prices. Consumer price inflation is based on the consumer price index for all urban consumers. Real GDP growth and inflation rates are measured from the average of one calendar year to the next.
The unemployment rate is the number of people not working who are available for work and are either seeking work or expecting to be recalled from a temporary layoff, expressed as a percentage of the labor force. The unemployment rate and interest rates are calendar year averages.
GDP = gross domestic product.
CBO’s projections of real GDP growth are slightly above the central tendency in 2021 and are within the central tendency in 2022 in the Federal Reserve’s most recent Summary of Economic Projections (see Figure 2-8).14 For 2023, however, they are below the Federal Reserve’s full range; for the longer run, they are just inside the lower end of the full range. The agency’s projections of the unemployment rate are within the Federal Reserve’s central tendency in 2021 and 2022, near the top of the central tendency in 2023, and near the top of the full range over the longer term.
Figure 2-8.
Comparing CBO’s Forecasts With Those of the Federal Reserve
Percent

Data sources: Congressional Budget Office; Board of Governors of the Federal Reserve System, “Economic Projections of Federal Reserve Board Members and Federal Reserve Bank Presidents, Under Their Individual Assumptions of Projected Appropriate Monetary Policy, June 2021” (June 16, 2021), Table 1, https://go.usa.gov/x6mA2. See www.cbo.gov/publication/57263#data.
The full range of forecasts from the Federal Reserve is based on the highest and lowest of the 18 projections by the Board of Governors and the presidents of the Federal Reserve Banks. (One Federal Reserve official did not submit longer-run projections for the change in real GDP, the unemployment rate, or the federal funds rate.) The central tendency is, roughly speaking, the middle two-thirds of the full range, formed by removing the three highest and three lowest projections.
The federal funds rate is the interest rate that financial institutions charge each other for overnight loans of their monetary reserves.
Each of the data points for the federal funds rate represents a forecast made by one of the members of the Federal Reserve Board or one of the presidents of the Federal Reserve Banks in June 2021. The Federal Reserve officials’ forecasts of the federal funds rate are for the rate at the end of the year, whereas CBO’s forecasts are fourth-quarter values.
For CBO, longer-term projections are values for the last quarter of 2031. For the Federal Reserve, longer-term projections are described as the value at which each variable would settle under appropriate monetary policy and in the absence of future shocks to the economy.
Real values are nominal values that have been adjusted to remove the effects of changes in prices.
The unemployment rate is the number of people not working who are available for work and are either seeking work or expecting to be recalled from a temporary layoff, expressed as a percentage of the labor force.
Real GDP growth and inflation rates are measured from the fourth quarter of one calendar year to the fourth quarter of the next.
The unemployment rate is a fourth-quarter value.
GDP = gross domestic product; PCE = personal consumption expenditures.
a. The ends of the full range and central tendency are equal.
CBO’s projections of inflation, as measured by the growth rates of the PCE price index and the core PCE price index (which excludes changes in food and energy prices), are all within the Federal Reserve’s central tendency, with the exception of the projections in 2021, which are below the full range. (The Federal Reserve’s survey does not collect projections of core PCE inflation for the longer term.) For the federal funds rate, CBO’s projections are consistent with the Federal Reserve’s median forecast in 2021 and 2022, within the central tendency in 2023, and within the full range in the longer term.
Part of the variation between CBO’s projections and those of other forecasters is attributable to differences in the economic data available when the forecasts were completed and to differences in the economic and statistical models used to prepare them. In addition, other forecasts may reflect an expectation that additional legislation will be enacted, whereas CBO’s projections incorporate the assumption that current laws generally remain unchanged and that no significant additional funding or aid is provided.
A key difference between CBO’s economic projections and those made by Federal Reserve officials is that CBO attempts to construct its projections so that they fall in the middle of a range of possible outcomes under current law. By contrast, the Federal Reserve reports a different concept: Each Federal Reserve official provides a modal forecast—a forecast of the most likely outcome—reflecting his or her individual assessment of appropriate monetary policy, and the Federal Reserve reports ranges of those modal values. As with other forecasters, officials may assume additional legislation in their individual forecasts.
1. See Congressional Budget Office, An Update to the Budget and Economic Outlook: 2021 to 2031 (July 2021), www.cbo.gov/publication/57218.
2. The labor force participation rate is the share of the civilian noninstitutionalized population age 16 or older that has jobs or that is available for and actively seeking work.
3. See Congressional Budget Office, Additional Information About the Economic Outlook: 2021 to 2031 (February 2021), www.cbo.gov/publication/56989.
4. Many in-person service activities are now returning to normal. For example, data aggregated and anonymized daily from detailed information on credit and debit card transactions show that spending on restaurants and hotels has been above its prepandemic levels since mid-April; see “Opportunity Insights Economic Tracker” (accessed June 10, 2021), www.tracktherecovery.org. Other activities, such as entertainment and transport, remain below their prepandemic levels but are continuing to recover. For a detailed description of the tracking database, see Raj Chetty and others, “The Economic Impacts of COVID-19: Evidence From a New Public Database Built Using Private Sector Data” (November 2020), https://tinyurl.com/ds3k6trj (PDF, 4 MB).
5. Those estimates do not include the effects of nonlegislative actions, such as those taken by the Federal Reserve (for example, lowering interest rates and purchasing mortgage-backed and Treasury securities) and the Administration (for example, delaying deadlines for filing taxes). The estimates do account for the legislation’s funding of lending facilities established by the Federal Reserve to support the flow of credit to businesses, households, and state and local governments. The estimated effects on the deficit do not include any subsequent changes for economic or technical reasons. For more information, see Congressional Budget Office, The Effects of Pandemic-Related Legislation on Output (September 2020), www.cbo.gov/publication/56537; and John Seliski and others, Key Methods That CBO Used to Estimate the Effects of Pandemic-Related Legislation on Output, Working Paper 2020-07 (Congressional Budget Office, October 2020), www.cbo.gov/publication/56612. Those estimates, when expressed as a percentage of GDP, are divided by the historical and projected values of GDP in the current baseline forecast.
6. Those provisions are contained in divisions M, N, and EE of the Consolidated Appropriations Act, 2021. Those estimates reflect the effect on the deficit around the time of enactment and do not include any subsequent changes for economic or technical reasons.
7. Personal saving rose to high levels during the pandemic, in part because financial support provided to many households more than offset declines in income from employment, but also because many households cut back on expenditures. In general, the savings of low-income households rose chiefly because their incomes increased through policy support, whereas the savings of higher-income households reflected reductions in their discretionary expenditures on services, such as entertainment and travel. At the same time, higher-income households gained wealth from equities and housing values. Relative to the prepandemic plans of households, the increased rate of saving was probably unexpected, and some economic analysts refer to it as “excess savings” resulting from the pandemic. Personal saving during 2020 was much higher than economists had projected before the pandemic.
8. The noncyclical rate of unemployment is the rate of unemployment arising from all sources except fluctuations in aggregate demand. It is often termed the long-run natural rate of unemployment and was referred to in previous CBO reports as the underlying long-term rate of unemployment.
9. For further details on the factors affecting CBO’s interest rate projections, see Edward N. Gamber, The Historical Decline in Real Interest Rates and Its Implications for CBO’s Projections, Working Paper 2020-09 (Congressional Budget Office, December 2020), www.cbo.gov/publication/56891.
10. See Board of Governors of the Federal Reserve System, “Federal Open Market Committee Announces Approval of Updates to Its Statement on Longer-Run Goals and Monetary Policy Strategy” (press release, August 27, 2020), https://go.usa.gov/xGXXn.
11. See Board of Governors of the Federal Reserve System, 2020 Statement on Longer-Run Goals and Monetary Policy Strategy (August 2020), https://go.usa.gov/x6BKv.
12. See Congressional Budget Office, CBO’s Economic Forecasting Record: 2019 Update (October 2019), www.cbo.gov/publication/55505.
13. See Wolters Kluwer, Blue Chip Economic Indicators, vol. 46, no. 7 (July 12, 2021).
14. See Board of Governors of the Federal Reserve System, “Economic Projections of Federal Reserve Board Members and Federal Reserve Bank Presidents, Under Their Individual Assumptions of Projected Appropriate Monetary Policy, June 2021” (June 16, 2021), Table 1, https://go.usa.gov/x6mA2 (PDF, 1.4 MB). The range of Federal Reserve forecasts is based on the highest and lowest projections made by the members of the Board of Governors of the Federal Reserve System and the presidents of the Federal Reserve Banks; the central tendency is the range formed by removing the three highest and three lowest Federal Reserve forecasts. The median is the middle projection (or, if the number of projections is even, the average of the two middle projections) when the projections are arranged from highest to lowest. For comparison with the Federal Reserve’s longer-term projections, CBO uses its projections for the last quarter of the projection period.
Appendix AChanges in CBO’s Baseline Projections Since February 2021
Overview
The Congressional Budget Office estimates that if no new legislation affecting spending and revenues is enacted, the budget deficit for fiscal year 2021 will total $3.0 trillion. That amount is $0.7 trillion (or 33 percent) more than the $2.3 trillion deficit the agency estimated in February 2021, when it last updated its baseline budget projections. The difference in CBO’s projections is mostly attributable to the enactment of new legislation (see Figure A-1).1
CBO also now projects that if current laws generally remained in place, the cumulative deficit for the 2022–2031 period would be $12.1 trillion. That amount is $0.2 trillion (or 1 percent) less than the $12.3 trillion the agency projected in February.
Figure A-1.
Changes in CBO’s Baseline Projections of the Deficit Since February 2021
Trillions of Dollars

For 2021, the projected deficit is $0.7 trillion more than it was in the February 2021 baseline, primarily because of the effects of the American Rescue Plan Act of 2021.
For the 2022–2031 period, the projected deficit is $0.2 trillion less than it was in the February 2021 baseline. Revenue increases—which decrease deficits—are nearly offset by increases in deficits that stem from legislation, higher net interest costs, and increases in other types of spending.
Data source: Congressional Budget Office. See www.cbo.gov/publication/57263#data.
When CBO updates its baseline budget projections, it groups those revisions into three categories—legislative, economic, and technical. The categories are defined as follows:
- Legislative changes result from laws enacted since the agency published its previous baseline projections and generally reflect the budgetary effects reported in CBO’s cost estimates at the time the legislation was enacted.2 However, the evolution of the 2020–2021 coronavirus pandemic and policymakers’ responses to it have continued to affect many of the factors underlying CBO’s original cost estimates for legislation enacted since February 2021. For certain policies, including the expansion of unemployment compensation, the agency was able to update its assessment of the effects of that legislation and incorporate the results in the baseline projections presented here.3
- Economic changes arise from revisions the agency has made to its economic forecast (including those made to incorporate the macroeconomic effects of recently enacted legislation).4
- Technical changes are revisions to projections that are neither legislative nor economic.
The $0.7 trillion increase in the estimated deficit for 2021 is largely the result of a $1.1 trillion increase stemming from legislative changes that are attributable primarily to the American Rescue Plan Act of 2021 (ARPA, Public Law 117-2). That increase is partly offset by a decrease of $0.4 trillion in combined economic and technical changes (see Table A-1).
Table A-1.
Changes in CBO’s Baseline Projections of the Deficit Since February 2021
Billions of Dollars

Data source: Congressional Budget Office. See www.cbo.gov/publication/57263#data.
SNAP = Supplemental Nutrition Assistance Program; SSI = Supplemental Security Income; * = between -$500 million and $500 million.
a. Primary deficits exclude net outlays for interest.
Legislative changes also boosted projected deficits over the 2022–2031 period, as did economic changes. However, those differences are more than offset by technical changes, resulting in a $0.2 trillion decrease in the agency’s projected cumulative deficit.
- Legislative changes increased projected deficits by $1.0 trillion, primarily because of increases in outlays resulting from provisions of ARPA.
- The net effect of economic changes increased deficits by $0.1 trillion. Most significantly, the agency revised its projections of outlays upward by $1.5 trillion largely because it raised its forecasts of interest rates and inflation. That increase more than offset the projected decrease in deficits resulting from the higher revenues associated with higher projections of gross domestic product (GDP).
- Technical changes in the agency’s projections of revenues and outlays decreased projected deficits over the period by a total of $1.2 trillion, on net. The largest technical revision in a single budget category was an increase of $0.8 trillion in CBO’s projections of individual income tax revenues.
As a result of those changes, primary deficits—that is, deficits excluding net outlays for interest—are now projected to total $1.0 trillion less over the 2022–2031 period than they were in CBO’s February 2021 baseline projections. That decrease in primary deficits is mostly offset by an increase of $0.9 trillion in the agency’s projections of interest costs over that period.
In February, the agency projected that debt held by the public would be $35.3 trillion at the end of 2031. CBO now projects that such debt would reach $35.8 trillion by the end of that year if current laws generally remained unchanged. That increase in projected debt is mostly driven by the large rise in the 2021 deficit; over the 2022–2031 period, deficits are now projected to be slightly smaller than they were in February. Compared with the size of the economy, debt is currently projected to reach 106 percent of GDP in 2031—a ratio that is slightly smaller than the 107 percent that CBO projected in February—because GDP is now expected to be higher than previously anticipated.
Legislative Changes
To account for legislation enacted after January 12, 2021, CBO increased its estimate of the deficit for 2021 by $1.1 trillion and increased projected deficits over the 2022–2031 period by $1.0 trillion (see Table A-1). Those changes, which mostly affected outlays, primarily resulted from provisions of ARPA. Other legislation enacted since January had a minor effect on CBO’s projections.
Changes in Outlays
ARPA’s major provisions continued or expanded many of the programs that were originally enacted in 2020 in response to the coronavirus pandemic. Those programs include recovery rebates for individuals, funding for state and local governments to help offset eligible expenses stemming from the pandemic, funding for educational institutions, the expansion of unemployment compensation, an expansion of the child tax credit, funding for the Department of Health and Human Services (HHS) to address COVID-19 (the disease caused by the coronavirus), disaster relief, housing assistance, additional assistance to states for Medicaid, and other programs.
Mandatory Outlays. CBO projects that outlays associated with recently enacted legislation will total $1.0 trillion in 2021, $0.4 trillion in 2022, and $0.3 trillion over the 2023–2031 period. All of that added spending is for mandatory programs.5 Those legislative changes reflect both the original cost estimates produced by CBO and the staff of the Joint Committee on Taxation (JCT) and CBO’s baseline updates of the effects of certain components of that legislation. The updates were made in response to recent information about the ways in which the new laws have been implemented, actual outlays observed so far this year, and changes to the agency’s economic forecast. Taken together, those updates reduced outlays by $71 billion in 2021 and increased outlays by $39 billion over the 2022–2031 period.6
Recovery Rebates for Individuals. For tax year 2021, lawmakers created a refundable tax credit of $1,400 per person ($2,800 for joint filers), plus $1,400 for each dependent. The credit phases out for taxpayers whose adjusted gross income exceeds $75,000 ($150,000 for joint filers; $112,000 for head-of-household filers). CBO projects that those recovery rebates will increase outlays by $394 billion in 2021 and by $8 billion in 2022.
Coronavirus State and Local Fiscal Recovery Funds. Lawmakers provided $362 billion in additional funding to state, local, tribal, and territorial governments to help offset certain expenses stemming from the pandemic. CBO estimates that $284 billion will be spent in 2021, $77 billion in 2022, and an additional $1 billion in 2023.
Education Stabilization Fund. Lawmakers appropriated an additional $166 billion for the Education Stabilization Fund to help educational institutions respond to the pandemic. That funding included $123 billion for the Elementary and Secondary School Emergency Relief Fund and $40 billion for the Higher Education Emergency Relief Fund. CBO projects that outlays from that funding will total $12 billion in 2021 and $154 billion between 2022 and 2028.
Extension of Expanded Unemployment Compensation. Legislation enacted in response to the coronavirus pandemic significantly expanded unemployment compensation by increasing the amount of the benefits, enlarging the pool of eligible workers, and extending the length of time that beneficiaries can receive assistance.7 ARPA extended that expansion until September 2021. CBO currently estimates that mandatory outlays for the expansion will total $144 billion in 2021, $8 billion in 2022, and less than $1 billion over the 2023–2024 period.
That estimate is $50 billion less in 2021, and $3 billion less in 2022, than anticipated in the agency’s March 2021 cost estimate.8 CBO reduced its projections of those outlays for two major reasons. First, several states have announced that they are discontinuing one or more of the components of expanded unemployment compensation before the expansion’s authorization ends in September. In its original estimate, CBO projected that all states would participate in the programs until September. Second, because of the improving economy, the agency has lowered its forecast of the unemployment rate, resulting in fewer projected beneficiaries of the programs, which also reduced outlays.
Child Tax Credit. Another provision of ARPA expanded the child tax credit for 2021. The expansion increased the maximum tax credit from $2,000 to $3,000 ($3,600 for a child younger than 6) and made the credit fully refundable. Additionally, it converted half of the credit to a monthly advance payment instead of an annual payment that individuals typically receive when they file their tax returns. CBO projects that expansion of the child tax credit will increase outlays by $20 billion this year, $68 billion in 2022, and $4 billion over the 2023–2031 period.
HHS Funding for COVID-Related Activities. In ARPA, lawmakers appropriated funds to HHS to address COVID-19 through several activities, including COVID-19 testing, contact tracing, and mitigation. In addition, funding was provided for increased vaccinations and for the purchase, production, or distribution of medical supplies and equipment related to combating the pandemic. CBO projects that the funding will result in outlays of $26 billion in 2021 and $85 billion over the 2022–2030 period.
Disaster Relief. Lawmakers appropriated $50 billion for the Federal Emergency Management Agency’s Disaster Relief Fund, which was allocated to reimburse state, local, and tribal governments and nonprofit organizations for certain expenses incurred while responding to the coronavirus pandemic. CBO projects that funding will increase outlays by less than $1 billion in 2021 and by $42 billion over the 2022–2030 period. That projection reflects a shift in the timing of those outlays from amounts CBO originally estimated. Because spending from the Disaster Relief Fund has been much slower than expected, CBO now estimates that $11 billion less will be spent in 2021 than originally anticipated. Additionally, CBO now expects that a greater percentage of the funding will ultimately not be spent, resulting in $5 billion less in outlays over the 2021–2031 period.
Housing Assistance. Housing assistance for renters and homeowners provided through a variety of programs is projected to increase outlays by $20 billion in 2021 and by $22 billion from 2022 to 2026. Funding for those programs includes the following: $22 billion for benefits administered by the Emergency Rental Assistance Program, $10 billion for the Homeowner Assistance Fund, $5 billion for homeless assistance administered through the HOME Investment Partnerships Program, and $5 billion for tenant-based rental assistance.
Medicaid Financial Assistance to States. ARPA extended additional assistance to states for Medicaid. The most significant provisions among those changes was an enhanced Federal Medical Assistance Percentage (FMAP) for states that expand the program under the Affordable Care Act in the future and a temporary increase in the FMAP for Home and Community Based Services.9 In addition, ARPA made COBRA subsidies available from April to September 2021, which CBO projects will cause more people to keep employment-based coverage and fewer to enroll in Medicaid, thus reducing Medicaid spending in 2021.10 CBO projects those changes will reduce outlays by $6 billion in 2021 and increase them by $37 billion over the 2022–2031 period.
Other Programs. Other programs funded through ARPA include aid to the restaurant industry, grants for transit infrastructure, and pandemic relief for aviation workers. CBO estimates that outlays for those and other programs funded through ARPA will increase outlays by $140 billion this year and by $234 billion over the 2022–2031 period.
Net Interest. The changes that CBO made to its projections to reflect legislation enacted since January increased the deficit for 2021 by $1.1 trillion and the cumulative deficit for the 2022–2031 period by $0.7 trillion. However, those changes did not take into account the increase in net interest outlays related to debt service. The additional federal borrowing stemming from the larger annual deficits added $262 billion to CBO’s projection of total outlays for interest on federal debt over the 2022–2031 period.
Changes in Revenues
Because of legislative changes, CBO reduced its revenue projections by $80 billion (or 2 percent) in 2021 but increased them by $28 billion (or less than 1 percent) from 2022 to 2031. All of those changes stemmed from provisions of ARPA.
Individual Income Taxes. To account for legislation enacted since January, the agency decreased its estimate of individual income tax revenues by $78 billion in 2021 and by $13 billion over the 2022–2031 period. The largest reductions in 2021 occurred because of provisions of ARPA that suspend taxes on a portion of unemployment compensation and that provide health insurance premium assistance (COBRA benefits) for recently separated employees. Those decreases are partially offset by increases after 2023, largely from a provision of ARPA that extends a limitation on the amount of business losses that can be used to offset nonbusiness income by individual taxpayers.
Corporate Income Taxes. As a result of legislative changes, CBO increased its estimate of corporate income tax revenues by less than $1 billion in 2021 and by $33 billion from 2022 to 2031. Most of those changes stem from provisions of ARPA that expand a limitation on the deductibility of compensation of highly paid employees and that repeal a provision allowing U.S. multinational corporations to allocate interest expenses on a worldwide basis when determining their foreign tax credits.
Economic Changes
The economic forecast that underlies CBO’s baseline budget projections includes the agency’s projections of interest rates, wages and salaries, inflation, the unemployment rate, and other factors (such as GDP growth) that affect federal spending and revenues (see Figure A-2). The revisions that CBO made to projections of those economic factors decreased its estimate of the deficit in 2021 by $166 billion, almost entirely because of increased estimates of revenues (see Table A-1). However, for the 2022–2031 period, economic changes led to an increase of $71 billion in the cumulative deficit, the net result of an increase in projected outlays of $1.5 trillion that is mostly offset by a $1.4 trillion increase in projected revenues.
Figure A-2.
Changes in CBO’s Economic Forecast Since February 2021

Data source: Congressional Budget Office. See www.cbo.gov/publication/57263#data.
The data shown are for fiscal years.
a. As measured by the consumer price index for urban wage earners and clerical workers.
Changes in Outlays
CBO’s revisions to its economic forecast increased its estimate of outlays for the current year by $6 billion (or less than 1 percent). For 2021, net interest costs are $23 billion higher than previously projected, but those costs are partly offset by lower estimates of outlays for unemployment compensation because the unemployment rate is now projected to be lower this year than CBO estimated in February. In later years, the stronger economy leads to higher interest rates, inflation, and wages, increasing outlays, on net, by $1.5 trillion (or 2 percent) over the 2022–2031 period.
Mandatory Outlays. On net, in CBO’s projections, economic changes decreased mandatory outlays for 2021 by $16 billion (or less than 1 percent). That decrease mostly stems from reductions in estimated spending for unemployment compensation. For the 2022–2031 period, projections of mandatory outlays increased by $644 billion (or 2 percent). Upward revisions to projected outlays for Social Security account for nearly half of that increase.
Social Security. Over the 2022–2031 period, projected outlays for Social Security increased by a total of $300 billion (or 2 percent) for economic reasons. CBO now projects higher inflation and higher average wages than it did in February. Social Security provides annual cost-of-living adjustments (COLAs) based on changes in the consumer price index for urban wage earners and clerical workers (CPI-W). CBO increased its projection of CPI-W growth and COLAs, so projected Social Security benefits paid over the 2022–2031 period increased by $244 billion. The COLA that will take effect in January 2022 is currently projected to be 3.8 percent—the largest since 2009 and an increase of 1.8 percentage points from the agency’s previous estimate. (Changes to projections of COLAs in the remaining years of the period are smaller. For 2023, CBO increased its estimate of the COLA by 0.2 percentage points. For 2024 through 2031, projections are within 0.1 percentage point of the agency’s previous estimates.) In addition, CBO increased its projections of average wages, which boosted projected Social Security benefits for new recipients over the 2022–2031 period by $56 billion.
Medicaid and Medicare. CBO increased its projections of outlays over the 2022–2031 period by $185 billion (or 2 percent) for Medicare and by $87 billion (or 1 percent) for Medicaid. Spending for those programs is affected by changes in the prices of labor, goods, and services.11 CBO’s latest economic forecast includes upward revisions to the growth of wages and many prices, which push up projected payment rates for Medicaid and for many of the services provided by Medicare’s fee-for-service sector (such as hospital care and services provided by home health agencies and skilled nursing facilities).
Veterans’ Benefits and Services. CBO increased its projections of spending for veterans’ benefits and services over the 2022–2031 period by $28 billion (or 2 percent). That change is primarily attributable to a projected increase in outlays for disability compensation that resulted from higher projected COLAs.
Unemployment Compensation. CBO decreased its projection of spending for unemployment compensation by $13 billion (or 5 percent) for 2021 but increased it by $8 billion (or 2 percent) for the 2022–2031 period. Revisions to CBO’s economic forecast led the agency to lower the projected unemployment rate for 2021 through 2024 by an average of 1 percentage point per year, which reduced outlays for unemployment benefits. However, in the other direction, in the years after 2024, increased projections of wage growth (which increases the average weekly benefit amount) and the labor force (which increases caseloads) more than offset, on net, the decrease in spending that stems from lower projected unemployment in the near term. (Revisions to the economic forecast also contributed to CBO’s lowering its cost of pandemic unemployment compensation that was extended by ARPA, as discussed in the section titled “Legislative Changes.”)
Other Mandatory Programs. CBO updated its projections of outlays for several other mandatory programs to reflect changes in its economic forecast. Although those changes resulted in both upward and downward adjustments to such spending, they increased projected outlays, on net, for the 2022–2031 period by a total of $35 billion.
Discretionary Outlays. CBO’s baseline projections generally reflect the assumption that funding for discretionary programs keeps pace with inflation.12 As a result of increases in the agency’s forecasts of certain measures of inflation, projections of such funding over the 2022–2031 period increased relative to amounts in the previous baseline, and discretionary outlays are now projected to be $145 billion (or 1 percent) greater.13
Net Interest. Economic changes caused CBO to boost its estimate of net interest outlays by $23 billion (or 7 percent) this year and by $724 billion (or 16 percent) for the 2022–2031 period. The change this year is largely a result of higher inflation. For the 2022–2031 period, the change is largely the result of increased forecasts of inflation and interest rates on Treasury securities, which boosted CBO’s projections of net outlays for interest by $765 billion over that period.
Partially offsetting that increase, the agency lowered its projections of debt service costs by $41 billion over the 2022–2031 period because of the economic revisions to outlays and revenues. Those revisions stemming from CBO’s updated economic forecast decreased the projected deficit by $166 billion this year and by an additional $455 billion over the following three years. Although economic changes increased the projected 10-year deficit by $112 billion (before accounting for the change in debt-service costs), the smaller deficits through 2024 result in lower estimated debt-service costs throughout the 10-year period.
Changes in Revenues
Changes to CBO’s economic forecast led the agency to raise its projection of revenues by $173 billion (or 5 percent) in 2021 and by $1.4 trillion (or 3 percent) from 2022 to 2031. Increases in projections of the size of the economy—including wages and salaries, proprietors’ income, and corporate profits—resulted in increases in projected income and payroll taxes. In addition, economic changes, primarily to interest rates, increased estimated remittances from the Federal Reserve, on net, by $45 billion (or 4 percent) over the 2022–2031 period.
Individual Income Taxes. CBO raised its projections of individual income tax revenues by $103 billion (or 6 percent) in 2021 and by $747 billion (or 3 percent) over the 2022–2031 period; the increase stemmed largely from a 3 percent increase in projected wages and salaries over that period, owing to expectations of a stronger recovery in the labor market. CBO also increased its projections of income from other sources, including interest, dividends, capital gains realizations, and distributions from pensions and individual retirement accounts. Those factors were partially offset by projections of modestly higher inflation, which decreased receipts because many parameters of the tax system are indexed for inflation.
Payroll Taxes. CBO’s estimate of payroll tax revenues in 2021 increased by $25 billion (or 2 percent); for the 2022–2031 period, it rose by $378 billion (or 2 percent). That increase is largely the result of higher projections of wages and salaries.
Corporate Income Taxes. CBO raised its estimate of corporate income tax revenues by $42 billion (or 26 percent) for 2021 and by $238 billion (or 7 percent) for the 2022–2031 period, mostly because of higher forecasts of domestic profits, which were revised upward by $1.9 trillion over the 2022–2031 period.
Federal Reserve Remittances. CBO increased its estimate of remittances from the Federal Reserve between 2022 and 2031 by $45 billion. That change is largely the result of higher medium- and long-term interest rates than CBO previously forecast, which increased the agency’s projection of the Federal Reserve’s income from its purchases of Treasury securities and mortgage-backed securities.
Other Revenues. CBO increased its estimates of estate and gift taxes, customs duties, and excise taxes over the 2022–2031 period by a total of $34 billion (or 2 percent) in response to higher projections of economic growth, asset values, imports, and consumption of gasoline and other taxable fuels.
Technical Changes
Technical changes—those changes that are neither legislative nor economic—caused CBO to decrease its estimate of the deficit for 2021 by $204 billion and to decrease projected deficits over the 2022–2031 period by a total of $1.2 trillion (see Table A-1). Increases to projected income and payroll tax receipts account for most of those changes.
Changes in Revenues
CBO increased its revenue projection for 2021 by $243 billion (or 7 percent) and its projection for the 2022–2031 period by $871 billion (or 2 percent) for technical reasons. Recent collections of taxes that were higher than expected account for most of that change.
Individual Income Taxes. CBO raised its estimate of individual income tax receipts in 2021 by $227 billion (or 13 percent) and by $779 billion (or 3 percent) for the 2022–2031 period. Much of that upward revision stems from recent tax collections that have continued to be stronger than expected given the agency’s current economic forecast and estimated effects of recently enacted legislation. Those higher-than-anticipated receipts may reflect higher wages or other income, larger realizations of capital gains, or smaller-than-expected effects from temporary tax provisions enacted in response to the pandemic. Depending on the source, the effects of those factors on receipts might be expected to persist permanently, end abruptly, or even reverse. In CBO’s projections, that unexpected strength is expected to dissipate over the next few years. CBO also increased its projections of taxable distributions from defined contribution retirement accounts because of updated information about the amount of assets in those accounts, boosting receipts throughout the next decade.
Corporate Income Taxes. CBO increased its estimate of corporate income tax revenues by $31 billion (or 19 percent) for 2021 and by $94 billion (or 3 percent) for the 2022–2031 period. Those revisions reflect the recent strength in corporate receipts for 2020 and 2021, which is expected to be temporary, and upward revisions to the share of corporate profits that is expected to be taxable in the longer term.
Other Sources of Revenues. CBO decreased its projections of other revenues by $15 billion (or 1 percent) in 2021 and by $3 billion (or less than 1 percent) over the 2022–2031 period because of technical changes. The largest revision in 2021 was a decrease of $9 billion in estimated remittances from the Federal Reserve, reflecting payments that have been lower than expected so far this year.
The small net change over the 2022–2031 period is the result of offsetting changes to other sources. A decrease of $63 billion (or 7 percent) in customs duties was caused by administrative actions that removed tariffs on airplanes, alcohol, and produce from the European Union.14 That decrease was partially offset by an increase of $28 billion (or 8 percent) in estate and gift taxes, stemming from recently recorded collections, changes to mortality rates resulting from the pandemic, and other factors. In addition, CBO increased its projection of payroll taxes by $23 billion (or less than 1 percent), largely to account for an updated method of projecting tax-preferred employee contributions for health insurance, which reduce payroll taxes.
Changes in Outlays
Because of technical updates, CBO increased its projection of outlays for 2021 by $39 billion (a little less than 1 percent) and decreased them by $349 billion (or about half a percent) over the 2022–2031 period. Changes to mandatory programs account for about half of the overall technical changes to outlays that CBO made since publishing its February 2021 baseline budget projections. Reductions in projections of net interest costs account for most of the other half, and changes to estimates of discretionary spending account for the rest.
Mandatory Outlays. For technical reasons, CBO increased its estimates of spending this year for some programs and decreased spending estimates for others. On net, the technical changes increased mandatory outlays for 2021 by $52 billion (or 1 percent). For the 2022–2031 period, projections of mandatory outlays decreased by $192 billion (or half a percent).
Medicare. CBO lowered its projections of outlays for Medicare by $12 billion this year and by $184 billion over the 2022–2031 period, a decrease of about 2 percent for both periods. That reduction mostly stems from less spending in the Medicare Advantage (MA) program in 2021 than CBO had projected in the February baseline. That lower-than-expected spending led CBO to lower projected outlays for Medicare by $249 billion over the 2022–2031 period. That decrease is offset in part by a shift in the projected number of enrollees from Medicare’s fee-for-service program to MA, increasing costs to Medicare by $30 billion over the same period. CBO also reduced its projections of offsetting receipts by about $43 billion to reflect slightly lower income from Part B (Medical Insurance) premiums. (Offsetting receipts are considered negative outlays; thus, a decrease in offsetting receipts results in an increase in outlays.) Other, smaller changes reduced outlays by $8 billion.
Social Security. Projected outlays for Social Security decreased by $7 billion in 2021 and by $91 billion over the 2022–3031 period for technical reasons. Most of that reduction occurred because CBO lowered its projections of Social Security caseloads on the basis of actual caseloads so far this year. Those caseloads have been slightly lower than CBO estimated in February. Furthermore, in its February projections, CBO incorporated the expectation that the decline in employment caused by the pandemic would boost applications for benefits. Given the number of applications for benefits this year and the path of the pandemic, CBO now expects the pandemic to have a smaller overall effect on the number of new Social Security claimants.
Premium Tax Credits and Related Spending. CBO and JCT increased their projections of outlays for premium tax credits and related spending in 2021 by $9 billion (or 16 percent) and, over the 2022–2031 period, by $44 billion (or 8 percent), on net.15 That increase is the result of projections of marketplace enrollment that are 20 percent higher, on average, over the 2022–2031 period than CBO previously estimated. The increase is partially offset by a reduction in the estimated average subsidy that results from a change in the projected income distribution of marketplace enrollees.
Supplemental Nutrition Assistance Program. CBO increased projections of outlays for the Supplemental Nutrition Assistance Program (SNAP) by $3 billion (or about 2 percent) in 2021 and by $37 billion (or 5 percent) over the 2022–2031 period. Most of that increase results from several administrative actions that caused CBO to remove the effects of certain SNAP eligibility and benefit rules from its baseline. Those rules, if made final and implemented, would have decreased the number of beneficiaries and the amount of their benefits on average.16 Removing the potential effects of those rules boosted projected SNAP outlays by roughly $25 billion. Additionally, the Administration established a minimum emergency allotment for households that receive certain benefits under the Families First Coronavirus Response Act. That new minimum boosted CBO’s projections of households’ SNAP benefits by $13.5 billion in 2021 and 2022.
Supplemental Security Income. CBO decreased its projections of outlays for Supplemental Security Income (SSI) by less than $1 billion (or 1 percent) this year and by $33 billion (or nearly 5 percent) over the 2022–2031 period for technical reasons. Most of that reduction is the result of lower projections of the number of new beneficiaries. In the near term, CBO reduced the expected number of new beneficiaries to account for the people added to the program’s benefit rolls so far in 2021. Additionally, the Social Security Administration (SSA) has delayed acting on the First Circuit’s 2020 decision in United States v. Vaello-Madero, which would make residents of Puerto Rico eligible for SSI benefits, until the U.S. Supreme Court rules on the case. In its February 2021 baseline, CBO had projected that SSA would launch SSI in Puerto Rico in the summer of 2021. In its current baseline, CBO projects that implementation will happen later, in the spring of 2022. For the 2024–2031 period, CBO lowered its projections of new SSI beneficiaries to incorporate the results of an analysis showing that the population-adjusted growth in new beneficiaries was lower than previously projected.
Veterans’ Benefits and Services. Mandatory outlays from programs that provide benefits and services to veterans are estimated to be $7 billion (or 5 percent) lower in 2021 than they were in CBO’s February baseline for technical reasons. However, over the 2022–2031 period, projections of those outlays increased by $21 billion (or 1 percent). Most of the decrease in 2021 is the result of revisions the Administration made to the estimated subsidy cost of providing guarantees on home loans to veterans.17 Those revisions decreased outlays for the program by about $8 billion. That amount is partially offset by other, smaller changes to the program that total $1 billion. For the 2022–2031 period, CBO increased its projections of the number of people receiving veterans’ compensation because the backlog of claims for those benefits grew by about 100,000 in 2020. CBO expects total benefits paid to increase over the next several years as that backlog is addressed.
Medicaid. CBO increased its estimate of outlays for Medicaid by $16 billion (or 3 percent) in 2021, but projected outlays for the program over the 2022–2031 period are $20 billion (or less than half a percent) lower than in February’s baseline. The increase in the near term is attributable to two factors: Actual spending in 2021 has been higher than expected, and new data from the Centers for Medicare & Medicaid Services was incorporated in CBO’s baseline. Those data indicated that a greater share of Medicaid spending in 2020 was for services with faster growth and a higher FMAP than previously estimated. The reductions in spending in later years are attributable to lower overall projected SSI caseloads, which result in lower projections of SSI beneficiaries who are enrolled in Medicaid.
Unemployment Compensation. CBO increased its projections of outlays for unemployment compensation by $7 billion (or 3 percent) in 2021 but lowered them by $6 billion (or 2 percent) for the 2022–2031 period. Most of the increase in 2021 is the result of people receiving unemployment benefits for a longer period than previously expected. For the 2022–2031 period, CBO decreased its projections of average weekly benefits on the basis of the weekly amounts beneficiaries have received in 2021 and reduced its projections of the average duration that people draw benefits on the basis of an analysis of how long people have historically collected benefits during periods of low unemployment.
Student Loans. CBO’s projections of outlays for student loan programs jumped by $99 billion in 2021. Outlays for student loan programs are now projected to total $99 billion this year, compared with -$1 billion last year. Nearly all of that increase ($95 billion) stems from revisions that the Department of Education made to the estimated subsidy costs of outstanding loans issued before 2021. Of that total, $56 billion results from changes to the department’s estimates of the performance of outstanding loans, mostly related to borrowers in income-driven repayment plans. The other $39 billion results from COVID-related administrative actions that include suspending repayment, interest accrual, and involuntary collections on student loans until the end of this fiscal year. CBO increased the projected cost of student loan programs after 2021 by $8 billion for technical reasons, largely reflecting increased projections of defaults and lower projections of collections on loans that default and loan volume.
Other Revisions to Credit Programs. Changes recorded by the Administration to the subsidy costs of loans and loan guarantees made before 2021 under credit programs other than veterans’ home loans and student loans caused CBO’s estimate of mandatory outlays to drop in 2021 by $51 billion. The largest of those changes are as follows: a $19 billion reduction in the cost of certain Small Business Administration disaster loan programs, a $13 billion reduction in the cost of the Economic Stabilization Program, and a $13 billion reduction in the cost of loan guarantees provided by the Federal Housing Administration.
Other Mandatory Programs. Smaller technical changes decreased CBO’s projections of outlays for other mandatory programs by $5 billion in 2021 and increased them by $39 billion over the 2022–2031 period.
Discretionary Outlays. Technical updates decreased CBO’s estimate of discretionary outlays in 2021 by $16 billion (or 1 percent) and reduced its projections of such outlays over the 2022–2031 period by $41 billion (or less than 1 percent). Many of those changes reflect the recent rates at which funding for various discretionary programs has been spent. Some of those reductions arose because ARPA provided a significant amount of mandatory funding for programs that are historically funded through annual appropriation acts. That additional mandatory funding caused the estimated spending of discretionary appropriations to slow.
Those reductions were offset somewhat because the Office of Management and Budget determined that a little over $3 billion provided in authorizing sections of the Consolidated Appropriations Act, 2021, should be considered discretionary spending. That change boosted CBO’s projections of discretionary outlays by a little less than $3 billion in 2021 (and reduced mandatory spending by a commensurate amount).
Net Interest. Technical changes decreased CBO’s projections of net interest outlays for the 2022–2031 period by $116 billion (or 3 percent). Technical changes to revenues and noninterest outlays reduced CBO’s projections of debt held by the public in 2031 by $1.3 trillion, thereby reducing the cost of servicing that debt by an estimated $150 billion over the 2022–2031 period. That reduction is partly offset by a $34 billion increase in net interest costs resulting from other technical changes. The largest such change is an increase in CBO’s projections of the share of the Treasury’s portfolio that consists of bonds, which are long-term securities that typically have higher interest rates. (CBO projects that bonds will comprise over 20 percent of debt held by the public in 2031.) Those technical changes caused projected interest payments to increase by about $38 billion. Other, smaller changes reduced CBO’s projections of net interest costs by about $4 billion on net over the 2022–2031 period.
1. See Congressional Budget Office, Additional Information About the Budget Outlook: 2021 to 2031 (March 2021), www.cbo.gov/publication/56996.
2. The baseline projections described in this report incorporate the effects of legislation enacted through May 18, 2021. The most recent law with significant budgetary effects reflected in this analysis was enacted on April 14, 2021 (Public Law 117-7). The main purpose of that law is to continue—through December 31, 2021—to temporarily exempt Medicare from mandatory spending reductions that would otherwise occur.
3. CBO does not routinely update cost estimates for enacted legislation when economic and technical factors change after enactment. Doing so is often difficult, particularly when the budgetary effects of that legislation cannot be separately identified. However, in preparing its baseline projections for this report, CBO had enough new information to update its estimates for some components of legislation enacted since February. For those components, CBO has incorporated updates to the originally estimated costs.
4. The current budget projections are based on CBO’s latest economic forecast, which was completed on May 18, 2021, and reflects the agency’s estimates of the effects on the economy of legislation enacted before that date. The economic changes discussed in this report reflect differences between that forecast and CBO’s February 2021 forecast.
5. Mandatory spending consists of outlays for some federal benefit programs, such as Social Security, Medicare, and Medicaid, and certain other payments to people, businesses, nonprofit institutions, and state and local governments. It is governed by statutory criteria and is not normally controlled by the annual appropriation process.
6. Because of how the Treasury is recording the effects of certain provisions of new laws, CBO has adjusted its estimates so that some amounts shown in initial cost estimates as increases in outlays are now designated as reductions in revenues. Those shifts have no effect on projections of the deficit.
7. See Congressional Budget Office, An Update to the Budget Outlook: 2020 to 2030 (September 2020), www.cbo.gov/publication/56517.
8. See Congressional Budget Office, Estimated Budgetary Effects of H.R. 1319, the American Rescue Plan Act of 2021 (March 10, 2021), www.cbo.gov/publication/57056.
9. The FMAP is the share of Medicaid costs paid by the federal government and is based on a formula that provides higher federal reimbursement to states with lower per capita incomes (and vice versa) relative to the national average. By law, states can receive an FMAP rate of no less than 50 percent and no more than 83 percent.
10. Under current law, people who lose their job or experience another qualifying event that results in a termination of their employment-based health insurance are eligible to continue receiving health insurance coverage through provisions of the Consolidated Omnibus Budget Reconciliation Act (COBRA). People who qualify for coverage through COBRA are often required to pay premiums to maintain their employment-based health insurance. COBRA subsidies are intended to help individuals offset the cost of those premiums.
11. By law, many of Medicare’s payment rates are also adjusted to account for gains in private nonfarm business productivity (the ability to produce the same output using fewer inputs, such as hours of labor) that occur over a 10-year period. See Centers for Medicare & Medicaid Services, “Market Basket Research and Information” (accessed July 6, 2021), https://go.usa.gov/xsB2D. Changes to CBO’s forecast for productivity increased projected Medicare spending but had a smaller effect than the changes in prices.
12. Funding that is provided in annual appropriation acts (and the outlays that result) is generally categorized as discretionary. In consultation with the House and Senate Committees on the Budget, CBO did not extrapolate into the future the $184 billion in discretionary funding that was designated as an emergency requirement to address the pandemic. CBO also did not extrapolate into future years $3 billion in funding provided for 2021 in division N of the Consolidated Appropriations Act, 2021 (P.L. 116-260). The agency classified that amount, which was also provided in response to the pandemic, as mandatory funding in its cost estimate but reclassified it as discretionary funding in its July 2021 baseline.
13. For its projections of discretionary funding related to federal personnel, CBO is required to use the employment cost index for wages and salaries; for its projections of other types of discretionary funding, the agency is required to use the GDP price index.
14. In October 2019, the United States imposed duties on certain agricultural goods, aircraft, and other products from Europe. In March 2021, those duties were temporarily suspended by administrative action. CBO’s baseline projections incorporate the assumption that in cases in which the Administration exercises its broad authority to impose tariffs without legislative action, the tariffs in effect when the agency completed its economic forecast would continue permanently without planned or unplanned changes. In June 2021, the temporary suspension was made permanent by the Administration.
15. The related spending consists almost entirely of outlays for risk adjustment and the Basic Health Program.
16. For a discussion of how CBO accounts for anticipated administrative actions in its baseline projections, see Congressional Budget Office, letter to the Honorable John M. Spratt Jr. (May 2, 2007), www.cbo.gov/publication/18615.
17. When the federal government makes or guarantees a loan, the budget records as an outlay the transaction’s projected subsidy cost—its estimated net cost over time, accounting for all expected future cash flows. The original subsidy calculation for a set of loans or loan guarantees may be increased or decreased in subsequent years by a credit-subsidy reestimate that reflects an updated assessment of the cash flows associated with the outstanding loans or loan guarantees.
Appendix BThe Short-Term Economic Effects of Recently Enacted Legislation
In the Congressional Budget Office’s projections, legislation enacted after January 12, 2021—primarily the American Rescue Plan Act of 2021 (ARPA, Public Law 117-2), which was enacted in March 2021—adds $1.1 trillion, or 5.0 percent of gross domestic product (GDP), to the deficit in fiscal year 2021 and $0.5 trillion, or 2.0 percent of GDP, in fiscal year 2022.1 (Those amounts exclude changes in debt service.) The various policies contained in the legislation are estimated to influence economic activity in different ways, so the economic effect per dollar of budgetary cost varies by policy.
From 2021 through 2024, the recently enacted legislation is expected to affect the economy through several channels. In CBO’s projections, the legislation increases economic activity, on net, mainly by providing temporary support to individuals, businesses, and nonfederal governments and by stimulating the overall demand for goods and services, which increases output and employment.
- Expanded unemployment compensation, recovery rebates for individuals (which are a kind of tax credit), and other financial support for households boost the overall demand for goods and services. (Expanded unemployment compensation also weakens incentives to work, partially offsetting the boost to economic activity.)
- Coronavirus State and Local Fiscal Recovery Funds provide direct assistance for state, local, tribal, and territorial governments. (CBO expects some of those funds to finance nonfederal government spending that would have occurred even without the receipt of such assistance; funding used in that way would not boost the economy in the short term.)
- Taken together, spending on public health activities, education, transportation, and disaster relief mostly increases government purchases of goods and services, directly boosting overall demand in the economy.
- Loans, grants, and tax benefits provide relief to businesses experiencing financial distress.
In CBO’s projections, the boost to real (inflation-adjusted) GDP through the end of 2021 is inhibited by social distancing and supply constraints in some labor and product markets. It is tempered in later years as output exceeds its potential (or maximum sustainable) level, diminishing slack—that is, underused productive resources—in the economy. The boost to economic activity over the next several years will also cause inflation and interest rates to be higher than they would be otherwise. All of those estimates are subject to considerable uncertainty.
Effects on Output and Employment
The recently enacted legislation will increase the level of real GDP by 1.0 percent in 2021, 2.7 percent in 2022, 1.4 percent in 2023, and 0.5 percent in 2024, CBO estimates (see Table B-1).2 From fiscal year 2021 through fiscal year 2024, the legislation is projected (excluding its effects on inflation) to increase GDP by 73 cents for every dollar that it adds to the deficit (see Table B-2). The provisions will have different effects on output because they will stimulate the economy through different channels and because they will support people and sectors that have been affected by the pandemic in different ways.
Table B-1.
The Economic Effects of Recently Enacted Legislation

Data source: Congressional Budget Office. See www.cbo.gov/publication/57263#data.
These effects are presented as a percentage of (or, for the effects on interest rates, a percentage-point difference from) implied projections of real GDP, payroll employment, consumer prices, and interest rates that do not include the effects of recently enacted legislation. Those projections were computed by removing the estimated effects of the legislation from CBO’s economic forecast. However, CBO did not construct a comprehensive projection of what the economy would have looked like without those legislative effects.
GDP = gross domestic product; PCE = personal consumption expenditures; * = between zero and 0.05 percentage points.
a. Real values are nominal values that have been adjusted to remove the effects of changes in prices.
Table B-2.
The Effects of Recently Enacted Legislation on the Deficit and on GDP, Fiscal Years 2021 to 2024

Data sources: Congressional Budget Office; staff of the Joint Committee on Taxation. See www.cbo.gov/publication/57263#data.
Any administrative costs associated with a provision are included in its effect on the deficit. Estimated effects on the deficit reflect changes in both revenues and outlays but exclude changes in debt service. Estimated effects on GDP exclude the effects of the legislation on inflation.
GDP = gross domestic product.
a. Recovery rebates for individuals are a kind of tax credit. The effect on the deficit is the result of a $404 billion increase in outlays and an $8 billion reduction in revenues.
b. Includes measures related to public health, Medicaid, and education, as well as transit grants and appropriations for the Disaster Relief Fund.
c. Includes spending on the Supplemental Nutrition Assistance Program, the Low-Income Home Energy Assistance Program, child care for workers, and housing assistance, as well as child tax credits and earned income tax credits.
d. Includes payroll support programs, credit support for small businesses, and payroll tax credits for employers, as well as support for restaurants, operators of shuttered venues, child care providers, and pension plans.
e. The effect on the deficit is the result of a $153 billion increase in outlays and a $29 billion reduction in revenues.
f. Includes some funding for child care and Community Development Block Grants, appropriations for the Economic Development Administration, and funding for the Emergency Connectivity Fund.
For example, provisions that directly increase government purchases of goods and services add to overall demand on a dollar-for-dollar basis. But for provisions that increase payments to households or businesses, reduce taxes, or increase aid to nonfederal governments, the size of the effect on demand depends on how the provision affects recipients’ behavior and on how the pandemic and social distancing affect recipients’ spending and other economic activities. In particular, increases in payments boost spending more among lower-income people than among higher-income people, partly because the spending of lower-income people tends to be more closely linked to their current income.
In CBO’s assessment, because households, in aggregate, have accumulated considerable private savings over the past several quarters, they will tend to spend the additional resources provided by the recently enacted legislation at a slower pace than they spent the resources provided in legislation enacted last year.3 In addition, most of the direct federal assistance provided to nonfederal governments by ARPA this year is projected to be spent by those governments in later years. Therefore, in CBO’s projections, the financial assistance to households, nonfederal governments, and businesses provided by the recently enacted legislation increases output for several quarters after the receipt of that assistance. Those spending patterns prevent a sudden drop in overall demand when the financial assistance provided by the recently enacted legislation stops, so real GDP is boosted over a longer period.
CBO also estimates that the recently enacted legislation will boost nonfarm payroll employment by 0.7 percent in 2021, 1.4 percent in 2022, 1.1 percent in 2023, and 0.6 percent in 2024. Those estimates are the net result of two opposing factors:
- Increased financial assistance to households, nonfederal governments, and businesses and increased government purchases boost the overall demand for goods and services, which increases output and employment.
- But the expanded unemployment compensation provided by ARPA weakens incentives to work because people compare the benefits available during a spell of unemployment with their potential earnings, and those weakened incentives decrease output and employment.
The expansion of unemployment compensation has effects that both increase employment (by boosting overall demand) and decrease it (by weakening incentives to work). In the spring and summer of 2021, those benefits are larger than potential earnings from work for many low-wage workers, CBO estimates. Although some states are discontinuing one or more of the components of expanded unemployment compensation, most unemployed people are still eligible to receive those benefits until they expire in September 2021. The incentive to continue receiving such benefits lengthens the amount of time beneficiaries remain unemployed. That increased duration can help recipients perform longer job searches that result in more productive jobs, but it also reduces employment and people’s work experience. On net, the effect of expanded unemployment compensation is to decrease employment this year. After the benefits expire in September 2021, reducing the weakened incentives to work, many people who previously received them will take several months to find work, in CBO’s estimation. After 2021, the net effect of expanded unemployment compensation will be to increase employment, as people spend benefits that they have saved.
Although the expansion of unemployment compensation reduces employment in 2021, on net, the policy increases output more than it reduces it in that year. The explanation for that apparent contradiction is that the policy reduces employment for low-wage workers and increases employment for a smaller number of high-wage workers, and those high-wage workers contribute more to GDP, on net.
Effects on Inflation and Interest Rates
CBO expects that the boost to economic activity from the recently enacted legislation will cause output to rise above its potential level in the second half of 2021. In 2022, the boost to overall demand from recently enacted legislation will drive the economy’s projected output further above its potential level. That boost is projected to keep output above its potential level for several years, causing inflationary pressures to build, pushing the price index for personal consumption expenditures 0.5 percent higher than it would have been otherwise by 2024. The higher consumer prices will reduce the purchasing power of the financial support for households provided by the recently enacted legislation.
However, even as output rises above its potential level and as inflationary pressures increase, the Federal Reserve is expected to keep interest rates low over the next few years. In CBO’s projections, a stronger economy and greater inflationary pressures prompt the Federal Reserve to push interest rates higher in 2023 than they would have been without the recently enacted legislation. The projected rates for 3-month Treasury bills and 10-year Treasury notes are higher by 0.2 percentage points in 2024 than they would have been otherwise.
1. CBO’s previous baseline budget projections, published in February 2021, include the effects of legislation enacted through January 12, 2021. See Congressional Budget Office, The Budget and Economic Outlook: 2021 to 2031 (February 2021), www.cbo.gov/publication/56970.
2. The estimates in this appendix are presented in relation to implied projections of output, employment, inflation, and interest rates that do not include the effects of the legislation—projections computed by removing the estimated effects of the legislation from CBO’s economic forecast. However, CBO did not construct a comprehensive projection of what the economy would have looked like without those legislative effects.
3. For information about how some federal laws enacted in 2020 affected CBO’s projections of output, see Congressional Budget Office, The Effects of Pandemic-Related Legislation on Output (September 2020), www.cbo.gov/publication/56537.
Appendix CCBO’s Economic Projections for 2021 to 2031
The tables in this appendix show the Congressional Budget Office’s economic projections for each year from 2021 to 2031. For the projections by calendar year, see Table C-1; for the projections by fiscal year, see Table C-2.
Table C-1.
CBO’s Economic Projections, by Calendar Year

Data source: Congressional Budget Office. See www.cbo.gov/publication/57263#data.
GDP = gross domestic product; PCE = personal consumption expenditures; * = between zero and 0.05 percentage points.
a. Real values are nominal values that have been adjusted to remove the effects of changes in prices.
b. Excludes prices for food and energy.
c. The consumer price index for all urban consumers.
d. Data for 2020 are based on data released after CBO completed its economic forecast. Projections are based on data available on May 18, 2021.
e. The employment cost index for wages and salaries of workers in private industries.
f. The average monthly change, calculated by dividing by 12 the change in payroll employment from the fourth quarter of one calendar year to the fourth quarter of the next.
g. Adjusted to remove distortions in depreciation allowances caused by tax rules and to exclude the effect of inflation on the value of inventories.
Table C-2.
CBO’s Economic Projections, by Fiscal Year

Data source: Congressional Budget Office. See www.cbo.gov/publication/57263#data.
GDP = gross domestic product; PCE = personal consumption expenditures; * = between zero and -500 jobs.
a. Real values are nominal values that have been adjusted to remove the effects of changes in prices.
b. Excludes prices for food and energy.
c. The consumer price index for all urban consumers.
d. The employment cost index for wages and salaries of workers in private industries.
e. The average monthly change, calculated by dividing by 12 the change in payroll employment from the fourth quarter of one fiscal year to the fourth quarter of the next.
f. Adjusted to remove distortions in depreciation allowances caused by tax rules and to exclude the effect of inflation on the value of inventories.
About This Document
This volume is one of a series of reports on the state of the budget and the economy that the Congressional Budget Office issues each year. It satisfies the requirement of section 202(e) of the Congressional Budget Act of 1974 for CBO to submit to the Committees on the Budget periodic reports about fiscal policy and to provide baseline projections of the federal budget. In keeping with CBO’s mandate to provide objective, impartial analysis, this report makes no recommendations.
CBO’s Panel of Economic Advisers commented on an early version of the economic forecast underlying this report at a meeting in April 2021. At that time, members of the panel were Katharine Abraham, Alan Auerbach, David Autor, Olivier Blanchard, Markus Brunnermeier, Seth Carpenter, Steven Davis, Kathryn Dominguez, Karen Dynan, Robert Hall, Jan Hatzius, Donald Kohn, Gregory Mankiw, Emi Nakamura, Jonathan Parker, James Poterba, Valerie Ramey, Aysegul Sahin, James Stock, Kevin Warsh, and Mark Zandi. Matthew Luzzetti and David Wilcox attended the panel’s meeting as guests. Although CBO’s outside advisers provided considerable assistance, they are not responsible for the contents of this report.
The following pages list CBO’s staff members who contributed to this report by preparing the economic, revenue, and spending projections; writing the report; reviewing, editing, fact-checking, and publishing it; compiling the supplemental materials posted along with it on CBO’s website (www.cbo.gov/publication/57263#data); and providing other support.
CBO continually seeks feedback to make its work as useful as possible. Please send any comments to communications@cbo.gov.

Phillip L. Swagel
Director
July 2021
Economic Projections
The economic projections were prepared by the Macroeconomic Analysis Division, with contributions from analysts in other divisions. That work was supervised by Jeffrey Werling, John Kitchen, Robert Arnold, and Devrim Demirel.
Aaron Betz · Effects of fiscal policy
Yiqun Gloria Chen · Labor markets
Erin Deal · Housing, model and data management
Daniel Fried · Net exports, exchange rates, energy prices
Edward Gamber · Interest rates, monetary policy, current-quarter analysis
Ron Gecan · Energy prices
Mark Lasky · Business investment, housing
Junghoon Lee · Effects of fiscal policy
Vinay Maruri · Financial markets
Michael McGrane · Financial markets
Jaeger Nelson · Effects of fiscal policy
Sarah Robinson (formerly of CBO) · Motor vehicle sector, research assistance
Jeffrey Schafer · Inflation, house prices
John Seliski · Federal, state, and local government spending and revenues; effects of fiscal policy
Robert Shackleton · Potential output, productivity
Christopher Williams · Consumer spending, income
Revenue Projections
The revenue projections were prepared by the Tax Analysis Division, supervised by John McClelland, Joseph Rosenberg, Joshua Shakin, and Edward Harris. In addition, the staff of the Joint Committee on Taxation provided valuable assistance.
Kathleen Burke · Individual income taxes, wage distribution
Paul Burnham · Retirement income
Dorian Carloni · Business taxation
Madeleine Fox · Customs duties
Nathaniel Frentz · Federal Reserve System’s earnings, miscellaneous fees and fines
Bilal Habib · Tax modeling
Shannon Mok · Estate and gift taxes
James Pearce · Capital gains realizations, wage distribution, tax modeling
Kevin Perese · Tax modeling
Tess Prendergast · Excise taxes
Molly Saunders-Scott · International taxation, business taxation
Kurt Seibert · Payroll taxes, depreciation, tax modeling
Jennifer Shand · Corporate income taxes
Naveen Singhal · Capital gains realizations, tax modeling
Ellen Steele · Refundable tax credits
James Williamson · Business taxation, estate and gift taxes
Spending Projections
The spending projections were prepared by the Budget Analysis Division, with contributions from analysts in other divisions. That work was supervised by Theresa Gullo, Leo Lex, Sam Papenfuss, Christina Hawley Anthony, Megan Carroll, Chad Chirico, Sheila Dacey, Kathleen FitzGerald, Paul Masi, Sarah Masi, David Newman, and Susan Willie of the Budget Analysis Division, as well as by Chapin White and Alexandra Minicozzi of the Health Analysis Division and by Sebastien Gay of the Financial Analysis Division.
Defense, International Affairs, and Veterans’ Affairs
Sunita D’Monte · International affairs
Caroline Dorminey · Defense (procurement)
Paul B. A. Holland · Veterans’ education benefits, reservists’ education benefits
Etaf Khan · Veterans’ health care and employment training services, international food assistance
William Ma · Defense (operation and maintenance, intelligence programs, other defense programs)
Aldo Prosperi · Defense (research and development, cybersecurity)
David Rafferty · Military retirement, compensation for radiation exposure and energy employees’ occupational illness
Dawn Sauter Regan · Defense (military personnel)
Matt Schmit · Military health care
Logan Smith · Veterans’ compensation and pensions, other benefits for disabled veterans
Health
Alice Burns · Medicaid, health insurance coverage
Julia Christensen · Food and Drug Administration, prescription drugs
Katherine Feinerman · Health insurance coverage
Ryan Greenfield · Prescription drugs, National Institutes of Health, Food and Drug Administration
Cornelia Hall · Medicare
Stuart Hammond · Medicare, Federal Employees Health Benefits program
Caroline Hanson · Health insurance coverage
Jared Hirschfield · Health insurance marketplaces, private health insurance
Ben Hopkins · Health insurance coverage
Lori Housman (formerly of CBO) · Medicare
Geena Kim · Medicaid, health insurance coverage
Brian Klein-Qiu · Medicare
Sean Lyons · Health insurance coverage
Rachel Matthews · Centers for Medicare & Medicaid Services
Eamon Molloy · Health insurance coverage
Hudson Osgood · Medicare
Romain Parsad · Health insurance coverage
Allison Percy · Health insurance coverage
Lisa Ramirez-Branum · Medicaid, health insurance coverage
Lara Robillard · Medicare
Asha Saavoss · Medicare
Sarah Sajewski · Medicare, Public Health Service
Robert Stewart · Medicaid, Children’s Health Insurance Program, Indian Health Service
Carolyn Ugolino · Health insurance marketplaces, private health insurance
Emily Vreeland · Health insurance marketplaces, private health insurance
Ellen Werble · Prescription drugs, Public Health Service
Kate Young · Medicaid, prescription drugs
Chris Zogby · Health insurance coverage
Income Security and Education
Susan Yeh Beyer · Child nutrition and other nutrition programs, Smithsonian Institution, arts and humanities
Meredith Decker · Unemployment insurance, job training programs
Elizabeth Cove Delisle · Housing assistance
Jennifer Gray · Supplemental Nutrition Assistance Program and other nutrition programs, Social Services Block Grant, support programs for children and families
Justin Humphrey · Student loans, higher education
Arin Kerstein · Refugee assistance
Wendy Kiska · Pension Benefit Guaranty Corporation
Leah Koestner · Elementary and secondary education, Pell grants
Justin Latus · Supplemental Security Income, Administration on Aging
Susanne Mehlman · Temporary Assistance for Needy Families, child support enforcement, foster care, child care programs, Low Income Home Energy Assistance Program
Noah Meyerson · Old-Age and Survivors Insurance, Social Security trust funds, Pension Benefit Guaranty Corporation
Emily Stern · Disability Insurance
Natural and Physical Resources
Tiffany Arthur · Agriculture
Madeleine Fox · General government
Kathleen Gramp · Energy, Outer Continental Shelf receipts, spectrum auction receipts, Orderly Liquidation Fund
Sofia Guo · Workplace and mine safety
Evan Herrnstadt · Spectrum auction receipts
David Hughes · Recreational resources, commerce, Small Business Administration, Universal Service Fund
Wendy Kiska · Federal Deposit Insurance Corporation, Orderly Liquidation Fund
Aaron Krupkin · Energy, air and water transportation
Vinay Maruri · Federal Deposit Insurance Corporation
Michael McGrane · Fannie Mae and Freddie Mac
Erik O’Donoghue · Agriculture
Jeffrey Perry · Student loans, Fannie Mae and Freddie Mac, Federal Housing Administration
Matthew Pickford · General government, legislative branch
Stephen Rabent · Deposit insurance, credit unions, pollution control and abatement, Postal Service
Robert Reese · Federal Housing Administration, other natural resources, highways, mass transit, Amtrak
Mitchell Remy · Fannie Mae and Freddie Mac, Federal Housing Administration
Janani Shankaran · Science and space exploration, conservation and land management, spectrum auction receipts
Delaney Smith (formerly of CBO) · Federal Housing Administration
Jon Sperl · Community and regional development, Federal Emergency Management Agency, Bureau of Indian Affairs, judicial branch, administration of justice
Aurora Swanson · Water resources, Fannie Mae and Freddie Mac
Lindsay Wylie · Law enforcement, justice assistance, homeland security, Postal Service
Byoung Hark Yoo · Fannie Mae and Freddie Mac
Other Areas and Functions
Shane Beaulieu · Computer applications and data systems
Barry Blom · Budget projections
Joanna Capps · Appropriation bills (Labor, Health and Human Services, and Education; Legislative Branch)
Aaron Feinstein · Other interest, monthly Treasury data, historical data
Avi Lerner · Interest on the public debt, automatic budget enforcement and sequestration, Troubled Asset Relief Program
Amber Marcellino · Federal civilian retirement
George McArdle · Appropriation bills (Military Construction and Veterans Affairs; State and Foreign Operations)
Dan Ready · Various federal retirement programs, national income and product accounts, federal pay
Justin Riordan · Appropriation bills (Commerce, Justice, and Science; Financial Services and General Government)
Mark Sanford · Appropriation bills (Agriculture and Food and Drug Administration; Defense)
Esther Steinbock · Appropriation bills (Energy and Water Development; Transportation and Housing and Urban Development)
J’nell Blanco Suchy · Appropriation bills (Interior and Environment; Homeland Security), authorization bills
Patrice Watson · Computer applications and data systems
Olivia Yang · Budget projections and appropriation bills
Writing
Dan Ready prepared the visual summary, with assistance from Aaron Betz. Barry Blom wrote Chapter 1, with assistance from Joshua Shakin. Jeffrey Schafer wrote Chapter 2, with assistance from Nabeel Alsalam. Aaron Feinstein wrote Appendix A, with contributions from Nathaniel Frentz, Amber Marcellino, and Dan Ready. John Seliski wrote Appendix B. Erin Deal compiled Appendix C.
Reviewing, Editing, Fact-Checking, and Publishing
Mark Doms, Mark Hadley, Jeffrey Kling, and Robert Sunshine reviewed the report. The editing and publishing were handled by CBO’s editing and publishing group, supervised by Benjamin Plotinsky, and the agency’s communications team, supervised by Deborah Kilroe.
Christine Bogusz, Rebecca Lanning, Loretta Lettner, Bo Peery, and Benjamin Plotinsky were the editors; Casey Labrack and R. L. Rebach were the graphics editors; and Annette Kalicki published the report on CBO’s website.
Fiona Forrester, Daniel Fried, Edward Gamber, Jared Hirschfield, Paul B. A. Holland, Mark Lasky, Omar Morales, Tess Prendergast, Robert Shackleton, Christopher Williams, and Olivia Yang fact-checked the report. Ann E. Futrell, Kate Kelly, and Lara Robillard coordinated the preparation of tables of baseline projections; Aaron Betz coordinated the preparation of figures and tables related to economic projections. Erin Deal, Tess Prendergast, Dan Ready, and Olivia Yang compiled data and supplemental information, and Annette Kalicki coordinated the presentation of those materials.