
At a Glance
Tax expenditures are exclusions, deductions, credits, and net preferential rates in the federal tax system that cause government revenues to be lower than they would otherwise be for any given structure of tax rates. In this report, the Congressional Budget Office examines how the benefits from major tax expenditures in the individual income tax and payroll tax systems were distributed among households in different income groups in 2019.
CBO estimates that the tax expenditures examined here totaled about $1.2 trillion in 2019, or 5.8 percent of gross domestic product, and accounted for roughly three-quarters of the total budgetary effects of all tax expenditures that year. The smallest of the tax expenditures discussed here is the state and local tax deduction ($22 billion); the largest are the exclusion and deferrals for the contributions and earnings associated with pensions and retirement savings accounts ($276 billion) and the exclusion for employment-based health insurance ($280 billion including the payroll tax expenditure).
In 2019, the distribution of benefits from the tax expenditures analyzed in this report varied considerably among income groups:
- Overall, about half of the total benefits from income tax expenditures accrued to households in the highest quintile (that is, fifth) of the income distribution, whereas 9 percent of such benefits accrued to households in the lowest quintile. Payroll tax expenditures were more evenly distributed.
- Households in the lowest quintile received benefits equal to 16 percent of their total income before transfers and taxes, whereas households in the highest quintile received benefits equal to 7 percent of such income.
- Among the various tax expenditures, the distribution of benefits varied greatly. For example, about 95 percent of the benefits from the qualified business income deduction accrued to households in the two highest quintiles of the income distribution, whereas 82 percent of the benefits from the earned income tax credit accrued to households in the two lowest quintiles.
- Provisions of the 2017 tax act (Public Law 115-97) reduced the total estimate of benefits from income tax expenditures by 9 percent. On net, those provisions made the distribution of tax expenditures more progressive because most of the benefits reduced by the tax act would have accrued to households in the highest quintile.
Notes
Notes
Numbers in the text, tables, and figures may not add up to totals because of rounding.
All dollar amounts are in 2019 dollars and are rounded to the nearest hundred.
Unless this report indicates otherwise, all years referred to are calendar years; “income” refers to household income before accounting for means-tested transfers and federal taxes; “transfers” refers to means-tested transfers; and “taxes” refers to federal taxes.
Supplemental data for this analysis are available on CBO’s website at www.cbo.gov/publication/57413#data.
On the cover: Illustration by Jorge Salazar.
Visual Summary
A number of exclusions, deductions, credits, and net preferential rates in the federal tax system cause government revenues to be lower than they would otherwise be for any given structure of tax rates. Some of those provisions are called tax expenditures because they provide financial assistance for specific activities, entities, or groups of people. Tax expenditures, like many forms of federal spending, contribute to the budget deficit, affect the distribution of income, and influence how people work, save, and invest.
In this report, the Congressional Budget Office examines how certain tax expenditures in the individual income and payroll tax systems were distributed among households in different income groups in 2019, before the economic disruption caused by the 2020–2021 coronavirus pandemic and the enactment of legislation in response to it. Tax expenditures reduce the individual income taxes—and, in certain cases, the payroll taxes—that people would otherwise owe. However, the estimates of tax expenditures presented here, like those produced by the Joint Committee on Taxation and the Treasury Department, do not reflect the additional revenues that would be raised if the relevant tax provisions were eliminated, because the estimates do not account for the way taxpayers would change their behavior as a result.
In its analysis, CBO sorts households into income quintiles (that is, fifths) on the basis of a measure of income that comprises market income (including labor income, business income, and capital income) and social insurance benefits (including Medicare and Social Security). That broad measure of income is the same one the agency regularly uses to analyze the distributional effects of both means-tested transfers and federal taxes.
Shares of Major Tax Expenditures
The size and distribution of benefits across the income scale varied considerably among each of the major tax expenditures in 2019, according to CBO’s estimates.
Billions of 2019 Dollars

Exclusions for employment-based health insurance and retirement savings were the largest tax expenditures in 2019. Tax expenditures varied in terms of how their benefits were distributed. For example, 95 percent of the benefits from the qualified business income deduction accrued to households in the two highest income quintiles, whereas 82 percent of the benefits of the earned income tax credit accrued to households in the two lowest quintiles.
See Figure 2
Shares of Combined Major Tax Expenditures
The total benefits of all major tax expenditures were not evenly distributed in 2019. Higher-income households received a larger share of the benefits than did lower-income households.
Percent

About half of the benefits from income tax expenditures and about one-third of the benefits from payroll tax expenditures accrued to households in the highest income quintile, compared with 9 percent and 4 percent of those benefits, respectively, that accrued to households in the lowest quintile.
See Figure 5
Major Tax Expenditures as a Share of Income
When the benefits of major tax expenditures are measured as a share of income within each income group, households in the lowest quintile benefited the most in 2019.
Percentage of Income Before Transfers and Taxes

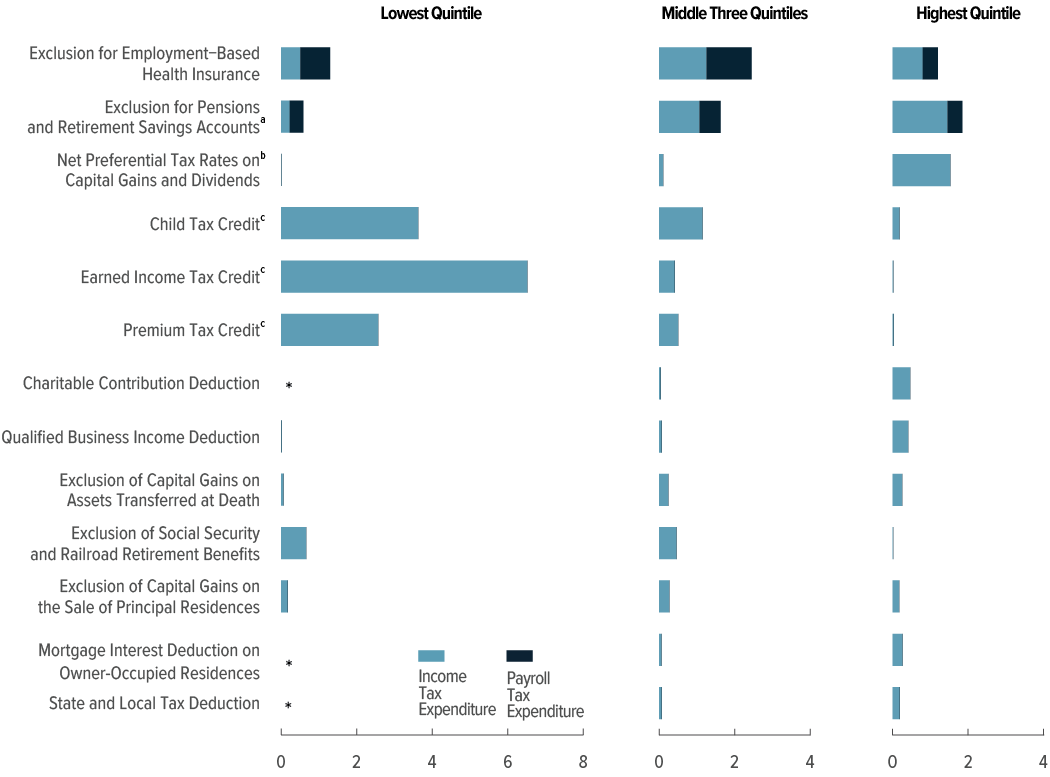
Households in the lowest quintile benefited more from the earned income tax credit and the child tax credit than from any other tax expenditures. Households in the middle three quintiles and highest quintile benefited more from the exclusions for pensions and retirement savings accounts and for employment-based health insurance than from any other tax expenditures. Households in the highest quintile also benefited from net preferential rates on capital gains and dividends.
* = less than 0.01 percent.
See Figure 4
Combined Major Tax Expenditures as a Share of Income
The total benefits of major tax expenditures as a share of household income were not distributed evenly among households in 2019. According to CBO’s estimates, households in the two lowest quintiles benefited the most from the tax expenditures when the expenditures are measured as a share of household income.
Percent

Households in the lowest income quintile benefited from tax expenditures by an amount equal to 16 percent of their income, whereas households in the highest quintile benefited by an amount equal to 7 percent of their income. Of all the households in the highest quintile, those in the top 1 percent of the income distribution benefited the most from tax expenditures as a share of their income.
See Figure 6
Effects of Provisions of the 2017 Tax Act on Major Tax Expenditures
Provisions of the 2017 tax act reduced individual income tax rates, expanded the child tax credit, and introduced the qualified business income deduction, but at the same time reduced three itemized deductions. The net effect was to decrease CBO’s total estimate of major income tax expenditures in 2019 by 9 percent, compared with what the estimate would be under 2026 tax rules, when many of the provisions of the 2017 tax act are set to expire.
Billions of 2019 Dollars

The total value of benefits from major tax expenditures in 2019 would have been higher under 2026 tax rules than it was under 2019 tax rules. Most of the additional benefits under the 2026 rules would accrue to households in the highest quintile.
See Box 2
Background
Exclusions, deductions, credits, and net preferential rates in the federal tax system cause government revenues to be lower than they would otherwise be for any underlying structure of tax rates. Various tax provisions in those four categories are called tax expenditures because they resemble federal spending and contribute to the budget deficit.
Like federal spending, tax expenditures provide financial assistance for specific activities, entities, and groups of people. They therefore alter people’s participation in the labor market, affect their choices about saving and consumption, and change the allocation of resources in the economy.
However, the budgetary treatment of tax expenditures differs from that of spending programs. Although tax expenditures increase the deficit by reducing the amount of revenues the government receives and records in the budget, the amount of forgone revenues attributable to specific tax expenditures (or to tax expenditures in general) is not separately recorded in the budget, whereas outlays for each spending program are recorded there.1 As a result, the costs associated with tax expenditures cannot be directly determined from the budget and must be estimated separately.
This analysis presents CBO’s estimates of the major tax expenditures in the individual income and payroll tax systems and examines how those tax expenditures were distributed among households with different amounts of income in 2019.2 CBO chose 2019 as the year of analysis because the distribution of tax expenditures in that year was unaffected by the economic disruption caused by the pandemic and the legislation enacted in response to it.
Defining Tax Expenditures
According to the Congressional Budget and Impoundment Control Act of 1974, tax expenditures are “those revenue losses attributable to provisions of the Federal tax laws which allow a special exclusion, exemption, or deduction from gross income or which provide a special credit, a preferential rate of tax, or a deferral of tax liability.” The Administration and the Congress regularly publish estimates of tax expenditures prepared by the Department of the Treasury’s Office of Tax Analysis and the staff of the Congress’s Joint Committee on Taxation (JCT), respectively.
Not all provisions in the tax code that alter tax liabilities create tax expenditures. For example, the standard deduction reduces tax liabilities for many taxpayers, but those reductions are not considered tax expenditures. Rather, tax expenditures are defined relative to a set of tax provisions that would typically be considered part of normal tax law (see Box 1). Each agency therefore uses its judgment to determine which provisions are part of normal tax law and which ones are tax expenditures. For the sake of consistency, in this analysis and in CBO’s regular reporting of tax expenditures with its budget projections, CBO follows JCT’s determinations about which provisions are tax expenditures.3
Box 1.
Reference Tax Systems
A tax expenditure represents revenues that would have hypothetically been collected under an alternative set of tax provisions. Most provisions in the tax code alter tax liabilities (and therefore revenues), but only some of those provisions, by definition, create tax expenditures. In general, a tax provision creates a tax expenditure if the provision deviates from a hypothetical “normal” tax system known as a reference tax system. What is defined as a tax expenditure can therefore vary significantly according to the reference tax system in which it is based. The most common basis of a reference tax system—and the one used by the Congressional Budget Office (CBO), the Joint Committee on Taxation (JCT), and the Treasury Department’s Office of Tax Analysis (OTA)—is an income tax in which all forms of income are taxed according to a single set of rates. An alternative basis for a reference tax system is a consumption tax, which taxes people on what they spend rather than what they earn.
Challenges of Estimating Tax Expenditures Under an Income Tax Framework
There is some debate about which sources of income should reasonably be counted in a taxpayer’s total net income in an income tax framework. A comprehensive measure of income would include all sources of income. However, the measure of income used by CBO (and by OTA and JCT) in the reference tax system excludes certain types of income that would theoretically be included in a comprehensive measure of income. The value of housework, for example, cannot be imputed accurately and is therefore excluded from the measure of income.
Another such exception occurs in the treatment of housing. A comprehensive measure of income would count the imputed rental income from owner-occupied housing—that is, the value of housing services consumed by the owner. Under such a system, a taxpayer’s mortgage interest could be deducted as a business expense—that is, an expense incurred to earn income. That corresponding income would be the rent that could have been earned if the taxpayer did not occupy the residence for which the deduction was claimed. The taxation of that imputed rental income would offset the deduction of mortgage interest. However, taxing imputed rent is administratively infeasible. When imputed rent is not taxed, the deduction of mortgage interest becomes a tax expenditure.
Measuring tax expenditures related to capital gains and dividends is also challenging. For example, a comprehensive income tax would tax all income at similar rates, but in the current income tax system and under the reference tax system used in this report, some capital income is subject to both the individual income tax and the corporate income tax. If tax expenditures were measured against a comprehensive income tax system, the estimates for most tax expenditures associated with capital gains and dividends would include the effects of corporate taxes.
Additionally, a comprehensive income tax would tax real income (that is, income adjusted to remove the effects of inflation). To the extent that gains on longer-term investments occur as a result of inflation rather than a real (inflation-adjusted) return on investment, the estimate of the tax expenditure will be larger because capital gains subject to tax are not indexed for inflation.
Differences Under a Consumption Tax Framework
Tax expenditures would still exist under a consumption tax framework, but they would differ from the expenditures estimated on the basis of an income tax.1 One way to tax consumption is to apply the tax when a good or service is purchased. A similar result is achieved by not taxing the return on saving, for example, by providing a deduction for net saving. The most notable differences between the two frameworks would arise from the classification and measurement of tax expenditures associated with investment and capital income. Because a consumption tax would exempt the return on saving, any tax resulting from the return on saving would not be considered a tax expenditure. In fact, any tax on capital income would be considered a negative tax expenditure—that is, a deviation from the reference tax system that increases rather than reduces tax liabilities.
For example, the tax expenditure associated with the exclusion for pensions and retirement savings accounts would not be considered a tax expenditure if it was estimated on the basis of a consumption tax. In contrast to an income tax, a consumption tax would not tax the return on assets held in those accounts. That treatment is equivalent to the treatment of the tax expenditure under current law, which provides a deduction for some contributions to pensions and retirement accounts and taxes those assets when they are withdrawn or distributed, usually upon retirement. As a result, that exclusion is defined as a tax expenditure when estimated under a reference tax system that is based on an income tax.
Other tax expenditures in this analysis would be significantly smaller or even negative if estimated relative to a consumption tax, namely the exclusion of capital gains on the sale of principal residences; the exclusion of capital gains on assets transferred at death; and net preferential tax rates on capital gains and dividends.
1. For an example of an analysis that classifies and measures tax expenditures relative to a consumption tax base, see Robert Carroll, David Joulfaian, and James Mackie, “Income Versus Consumption Tax Baselines for Tax Expenditures,” National Tax Journal, vol. 64, no. 2.2 (June 2011), pp. 491–510, https://tinyurl.com/zzj8ycn9.
Types of Tax Expenditures
In this analysis, tax expenditures are placed in one of four categories depending on how they are treated in the tax system: exclusions, deductions, credits, or net preferential rates.
Exclusions. Income from certain sources, or income used for certain purposes, is excluded from a taxpayer’s total income in the year that it is received, thereby reducing that taxpayer’s tax liability. The same amount of excluded income typically creates a larger tax expenditure among higher-income taxpayers than among lower-income taxpayers because individual income tax rates rise with income. Higher-income taxpayers are more likely than lower-income taxpayers to be in higher tax brackets, and so more revenues are lost by excluding income from a higher-income taxpayer’s taxable income. For example, a taxpayer in the 12 percent tax bracket who excludes $1,000 from taxable income saves $120 in taxes, but the same exclusion reduces the tax bill of a taxpayer in the 37 percent tax bracket by $370.
The exclusions analyzed in this report are for employment-based health insurance premiums, contributions and earnings associated with pensions and retirement savings accounts, capital gains on assets transferred at death, and capital gains on the sale of principal residences.
Deductions. Deductions allow taxpayers to reduce their taxable income, often by an amount that they have spent for a particular purpose. Deductions differ from exclusions because the income being deducted is still counted as part of a taxpayer’s adjusted gross income and is subject to payroll taxes. Like exclusions, however, that income is not considered part of the taxpayer’s taxable income. Because individual income tax rates increase with income, a deduction claimed by a higher-income taxpayer would typically create a larger tax expenditure than one claimed by a lower-income taxpayer.
Taxpayers can reduce the amount of their taxable income by availing themselves of either the standard deduction (which is not considered a tax expenditure) or of a number of other available deductions called itemized deductions. Three of the four deductions examined in this report are itemized deductions. Such deductions provide the largest benefits—in both absolute dollars and relative to income—to taxpayers with relatively high income because they benefit only those taxpayers for whom the value of the deductions is higher than the standard deduction. In 2019, 11 percent of tax filers itemized their deductions.
The itemized deductions analyzed in this report are for charitable contributions, mortgage interest, and state and local taxes. The other deduction analyzed in this report is for qualified business income.
Tax Credits. Unlike exclusions and deductions, credits reduce tax liability dollar for dollar by the amount of the credit, regardless of which tax bracket the taxpayer is in. Credits can be refundable (that is, fully available to every taxpayer who qualifies for the credit) or nonrefundable (that is, available only to the extent that they reduce a taxpayer’s liability to zero). For example, a taxpayer whose tax liability is $500 and who qualifies for a $600 refundable credit would receive a refund of $100. But if that credit was nonrefundable, the taxpayer would owe no taxes but would not receive a refund. Thus, rather than just reducing the amount of taxes owed to the government, refundable credits can result in net payments from the government, which are recorded as outlays in the federal budget.
Unlike the benefits of other types of tax expenditures, benefits from tax credits are skewed toward lower- and middle-income households, mainly for two reasons. First, the largest tax credits phase out to zero as income rises beyond certain thresholds, making higher-income taxpayers ineligible for the credits.4 Second, the value of credits is determined in fixed dollar amounts rather than as a proportion of a taxpayer’s income. As a result, a credit that goes to a lower-income household constitutes a larger share of that household’s income than if it had gone to a higher-income household.
The three tax credits analyzed in this report are the largest credits in the individual income tax system. They are the child tax credit, the earned income tax credit, and the premium tax credit for health insurance, all of which are refundable credits.5
Net Preferential Tax Rates. Under current law, some forms of income are taxed at rates that differ from those applied to other types of income. If the tax rate on a given form of income is lower than the ordinary tax rate, that difference will generate a tax expenditure. However, some types of income are also subject to surtaxes, which generate negative tax expenditures.6 The net result of those two tax expenditures is referred to in this report as the tax expenditure that arises from the net preferential tax rate.
Tax expenditures generated by net preferential tax rates are derived from the difference between the ordinary tax rate and the net preferential rate. Because ordinary tax rates increase with income, the tax expenditures generated by net preferential tax rates accrue mostly to higher-income taxpayers, who have higher ordinary rates. The largest individual income tax expenditure of that type—and the only one included in this report—is the tax expenditure that arises from net preferential rates on capital gains and dividends.
Estimating Tax Expenditures
In this analysis, CBO estimated the amount of each tax expenditure for each taxpayer as the difference between the taxpayer’s tax liability under 2019 law and the tax liability if the provisions generating that tax expenditure did not exist, but all other provisions remained in place, and the taxpayer’s behavior was unchanged.
Three characteristics of those estimates should be emphasized (see the appendix for more details about how CBO estimated tax expenditures). First, the tax expenditures are only allocated to taxpayers who would have been directly liable for more taxes in the absence of the expenditures, even though those expenditures may also affect other people. For example, CBO’s estimates of the distribution of the deduction for mortgage interest leave aside any effect of that tax expenditure on the amount of mortgage debt or on housing values. Those effects may encourage households—particularly higher-income households, which are subject to higher marginal tax rates—to purchase homes that are more expensive and to finance them with more debt than they otherwise would.7
Second, the analysis presents estimates of forgone payroll taxes in addition to estimates of forgone individual income taxes. Two of the tax expenditures in the analysis reduce both income taxes and payroll taxes: the exclusion for employment-based health insurance and the exclusion for pensions and retirement savings accounts. In both cases, the distributions of the forgone payroll taxes are less skewed toward higher-income households than are the distributions of forgone individual income taxes.8 In this report, those forgone payroll taxes are presented separately in the section on selected tax expenditures and are included in the combined estimates of tax expenditures.
Finally, the estimates of tax expenditures are not estimates of the additional government revenues that would be raised if the relevant provisions of law were eliminated. That is because the estimates of tax expenditures do not account for the way taxpayers would change their behavior as a result of eliminating the provisions. For example, if the net preferential tax rates on capital gains realizations were eliminated, some taxpayers would reduce the amount of capital gains they realize. Because the size of that tax expenditure is estimated on the basis of the amount of capital gains that are projected to be realized under current tax law, the amount of additional revenues that would be raised if that preference was eliminated would be smaller than the estimated size of the tax expenditure.
How Changes in Tax Policy Affect Tax Expenditures
The size of tax expenditures depends on tax law and on economic conditions. The total value of individual and corporate income tax expenditures (not including forgone payroll taxes) has risen over the past few decades.9 For example, tax legislation has expanded the earned income tax credit and adjusted the tax rate for long-term capital gains. More recently, both the Affordable Care Act and the 2017 tax act (Public Law 115-97) introduced new tax expenditures in the individual income tax system, such as the premium tax credit and the qualified business income deduction.10
Changes to tax policy can affect tax expenditures either directly or indirectly. For example, the 2017 tax act reduced the tax expenditure for state and local taxes paid by directly limiting the deduction to $10,000 per tax return, but it also indirectly reduced nearly all other tax expenditures by reducing ordinary tax rates and increasing the standard deduction. Some taxpayers who would otherwise have elected to itemize their deductions are now better off taking the standard deduction instead, thereby reducing the tax expenditures for itemized deductions such as those for charitable contributions or mortgage interest. (See Box 2 for more details about how the 2017 tax act affected the distribution of tax expenditures.)
Box 2.
How Provisions of the 2017 Tax Act Affected Major Tax Expenditures in 2019
Public Law 115-97 (referred to here as the 2017 tax act) made important changes to the tax system. Beginning in 2018, provisions of that act reduced individual income tax rates, added new limitations on itemized deductions, increased the standard deduction, repealed the personal exemption, and increased the child tax credit. Those changes affected the size and distribution of nearly every tax expenditure in the individual income tax system. In addition to creating the qualified business income deduction, the tax act also directly changed three tax expenditures: the child tax credit, the mortgage interest deduction, and the state and local tax deduction.
Distribution of Combined Major Income Tax Expenditures in 2019, Under 2019 Tax Rules and 2026 Tax Rules
Billions of 2019 Dollars

Data source: Congressional Budget Office, using estimates from the staff of the Joint Committee on Taxation. See www.cbo.gov/publication/57413#data.
In this analysis, the incidence of tax expenditures is assigned to the taxpayers who would have been directly liable for the relevant taxes if the provisions that generated the tax expenditure did not exist. Moreover, behavioral responses can affect the incidence of tax expenditures, but those responses and the resulting changes in incidence are not reflected in this report. For more details, see the section titled “Incidence of Tax Expenditures” in the appendix.
The 2026 tax law reflects the scheduled expiration of many provisions of the 2017 tax act. To construct the alternative scenario under 2026 tax rules, CBO adjusted the tax parameters for that year to be consistent with the economic conditions in 2019. The combined estimates shown here for the two scenarios do not include payroll tax expenditures, which would be the same in either scenario.
The combined estimates include interactions among the tax expenditures that would occur if the tax expenditures were simultaneously eliminated, except the tax expenditure arising from the exclusion for pensions and retirement savings accounts. Although that tax expenditure is included in the combined estimates, the effect of its interaction with the other tax expenditures is omitted because it is estimated using a present-value method, which reflects the value of forgone taxes over time that would result from current-year contributions. For more details, see the section titled “How CBO Estimated the Tax Expenditure Created by the Exclusion for Pensions and Retirement Savings Accounts” in the appendix.
The estimate of the tax expenditure arising from net preferential tax rates on capital gains and dividends includes the net effect of reduced rates on capital gains and dividends and the surtax on net investment income for high-income taxpayers.
The estimates of the tax expenditures arising from the three refundable tax credits—the child tax credit, the earned income tax credit, and the premium tax credit—include the portions of those tax credits that are classified as outlays in the federal budget.
Changes attributable to the tax act also affected tax expenditures indirectly through interactions between existing tax expenditures and other changes in the law. Some provisions in the tax act affected tax liability in ways that changed the benefits associated with tax expenditures, such as reduced marginal tax rates, the elimination of the personal exemption, and the larger standard deduction. Mainly because of the larger standard deduction, the number of tax returns in which taxpayers itemized their deductions decreased from 47 million in 2017 to 18 million in 2018—that is, from about 31 percent of all tax returns to 11 percent of them. That decrease reduced the estimate of tax expenditures created by deductions, such as the one for charitable contributions.
To examine the effects of provisions of the 2017 tax act, the Congressional Budget Office estimated how the benefits from the tax expenditures analyzed in this report were distributed under the tax rules in 2019, when the act was fully in effect, and how they would be distributed in 2026, when many of the provisions of the 2017 tax act are scheduled to expire. To calculate those differences, the agency used its microsimulation tax model to estimate the benefits of tax expenditures under both the 2019 tax rules and the tax rules scheduled to be in place in 2026. The demographic and economic conditions were identical in both scenarios.1
Income tax expenditures estimated under the 2026 tax rules are, in total, 9 percent more than estimated income tax expenditures in 2019—that is, provisions of the 2017 tax act reduced the total estimate of the income tax expenditures examined in this report by 9 percent. Most of the additional benefits that would occur under 2026 tax rules (when the tax act expires) would accrue to households in the highest quintile, which means that the tax act made the distribution of tax expenditures more progressive, even though the amount of tax expenditures accruing to the four lower quintiles remained roughly unchanged in aggregate (see the first figure in this box).
That result is mainly attributable to multiple offsetting effects among 5 of the 13 tax expenditures analyzed here (see the second figure, below). On the one hand, the child tax credit became larger and more available to taxpayers in higher-income households, and the benefits of the new qualified business income deduction were skewed toward the top of the distribution. On the other hand, the three preexisting deductions, which mostly benefited higher-income households, shrank.
Distribution of Selected Major Tax Expenditures in 2019, Under 2019 Tax Rules and 2026 Tax Rules
Billions of 2019 Dollars

Data source: Congressional Budget Office, using estimates from the staff of the Joint Committee on Taxation. See www.cbo.gov/publication/57413#data.
In this analysis, the incidence of tax expenditures is assigned to the taxpayers who would have been directly liable for the relevant taxes if the provisions that generated the tax expenditure did not exist. Moreover, behavioral responses can affect the incidence of tax expenditures, but those responses and the resulting changes in incidence are not reflected in this report. For more details, see the section titled “Incidence of Tax Expenditures” in the appendix.
The 2026 tax law reflects the scheduled expiration of many provisions of the 2017 tax act. To construct the alternative scenario under 2026 tax rules, CBO adjusted the tax parameters for that year to be consistent with the economic conditions in 2019.
The estimate of the tax expenditure arising from the child tax credit includes the portion of that tax credit that is classified as an outlay in the federal budget.
* = The amount is zero because the qualified business income deduction is currently scheduled to expire in 2026.
1. To construct the alternative scenario under 2026 tax rules, CBO adjusted the tax parameters for that year to be consistent with the economic conditions in 2019. For example, many tax parameters, such as the standard deduction, are indexed for inflation. In the alternative scenario, those parameters were deflated to reflect what their value would have been in 2019.
How Tax Expenditures Affect the Federal Budget
Tax expenditures significantly affect the federal budget by causing revenues to be lower than they would otherwise be for any underlying structure of tax rates. On the basis of estimates prepared by JCT, CBO estimates that the value of all tax expenditures in the individual and corporate income tax systems totaled $1.6 trillion, or 7.8 percent of gross domestic product (GDP), in fiscal year 2019. That amount was equal to nearly half of all federal revenues, exceeded all discretionary outlays, and equaled 61 percent of all mandatory spending in the federal budget, which includes spending on Social Security and Medicare (see Figure 1).
Figure 1.
Spending, Revenues, and Total Tax Expenditures, Fiscal Year 2019
Percentage of Gross Domestic Product

Data source: Congressional Budget Office, using estimates from the staff of the Joint Committee on Taxation. See www.cbo.gov/publication/57413#data.
a. The portions of refundable tax credits classified as outlays are included in both tax expenditures and mandatory outlays. In fiscal year 2019, they are estimated to have totaled 0.7 percent of gross domestic product.
b. This total is the sum of the estimates for all of the separate tax expenditures and does not account for any interactions among them. However, CBO estimates that in fiscal year 2019, the total for all tax expenditures, including the effects of their interactions, roughly equaled the sum of each expenditure considered separately. Furthermore, because estimates of tax expenditures are based on people’s behavior with the expenditures in place, they do not reflect the amount of revenues that would be raised if those provisions of the tax code were eliminated and taxpayers altered their behavior in response to the changes.
The Distribution of Major Tax Expenditures in the Individual Income Tax System
The tax expenditures examined in this report comprised the largest tax expenditures in the individual income tax system in 2019. The results of the analysis are thus unaffected by the economic disruption caused by the pandemic and the enactment of legislation in response to it. Included here are relatively new tax expenditures, such as the premium tax credit for health insurance, as well as those that were significantly altered by the 2017 tax act, such as the state and local tax deduction.
In this analysis, CBO reports calendar-year estimates for the tax expenditures. Where relevant, the estimates also include the effects of forgone payroll taxes. The estimates do not reflect the increase in revenues that would occur if the provisions that create the tax expenditures were eliminated, because they do not account for changes in taxpayers’ behavior that would likely occur in response to changes in tax law.
Although the tax expenditures analyzed here represent a small fraction of the more than 200 tax expenditures in the individual and corporate income tax systems, they accounted for about three-quarters of the total budgetary effects of all tax expenditures in 2019, CBO estimates.11 The total estimated value of the tax expenditures in this analysis was $1.2 trillion, or 5.8 percent of GDP (including forgone payroll taxes).
The tax expenditures varied in size, from $22 billion to $280 billion (see Table 1). The two largest tax expenditures, the exclusions for employment-based health insurance and for pensions and retirement savings accounts, are estimated to account for nearly half of the total estimated value of the tax expenditures in this report, or about 2.6 percent of GDP. The tax expenditure arising from net preferential tax rates on capital gains and dividends equaled about 0.7 percent of GDP, and the child tax credit equaled about 0.6 percent of GDP. The other nine tax expenditures examined here each equaled between 0.1 percent and 0.3 percent of GDP.
Table 1.
Major Tax Expenditures, 2019

Data source: Congressional Budget Office, using estimates from the staff of the Joint Committee on Taxation. See www.cbo.gov/publication/57413#data.
In this analysis, the incidence of tax expenditures is assigned to the taxpayers who would have been directly liable for the relevant taxes if the provisions that generated the tax expenditure did not exist. Moreover, behavioral responses can affect the incidence of tax expenditures, but those responses and the resulting changes in incidence are not reflected in this report. For more details, see the section titled “Incidence of Tax Expenditures” in the appendix.
a. The tax expenditure arising from the exclusion for pensions and retirement savings accounts was estimated using a present-value method, which reflects the value of forgone taxes over time that would result from current-year contributions. For more details, see the section titled “How CBO Estimated the Tax Expenditure Created by the Exclusion for Pensions and Retirement Savings Accounts” in the appendix.
b. The estimate of the tax expenditure arising from net preferential tax rates on capital gains and dividends includes the net effect of reduced rates on capital gains and dividends and the surtax on net investment income for high-income taxpayers.
c. The estimates of the tax expenditures arising from the three refundable tax credits—the child tax credit, the earned income tax credit, and the premium tax credit—include the portions of those tax credits that are classified as outlays in the federal budget.
Benefits from tax expenditures tend to skew toward one end of the income distribution or the other. Although there is significant variation in the distribution of each of the tax expenditures in this report, tax expenditures in a given category tend to have similar distributional effects. In general, deductions and net preferential tax rates tend to provide larger benefits to higher-income taxpayers, relative to income, than to other taxpayers. Exclusions of taxable income tend to be more evenly distributed, and tax credits generally provide larger benefits to lower-income taxpayers.
Exclusion for Employment-Based Health Insurance
Many employers contribute to the cost of providing health insurance to their employees and their employees’ families. Typically, employers and employees each pay a portion of insurance premiums. The employer’s portion is exempt from federal income and payroll taxes. In most cases, the employee’s portion is also excluded from both income and payroll taxes.12
In general, the benefit from the exclusion for employment-based health insurance is more likely to accrue to higher-income households because they are more likely to have access to employment-based health insurance. The premium tax credit, another tax expenditure examined in this report, is designed to benefit lower-income households, who typically do not have access to such insurance.
The exclusion for employment-based health insurance is the largest tax expenditure. According to CBO’s estimates, the total tax expenditure arising from that exclusion was $280 billion in 2019, of which $159 billion constituted the income tax expenditure and $121 billion constituted the payroll tax expenditure.
Most of the benefits from the exclusion for employment-based health insurance accrued to higher-income households (see Figure 2). CBO estimates that 44 percent of the income tax expenditure accrued to households in the highest quintile of the income distribution, 29 percent to the fourth quintile, 16 percent to the middle quintile, and 11 percent to the bottom two quintiles combined (see Table 2).
Figure 2.
Shares of Major Tax Expenditures, 2019
Billions of 2019 Dollars

Data source: Congressional Budget Office, using estimates from the staff of the Joint Committee on Taxation. See www.cbo.gov/publication/57413#data.
In this analysis, the incidence of tax expenditures is assigned to the taxpayers who would have been directly liable for the relevant taxes if the provisions that generated the tax expenditure did not exist. Moreover, behavioral responses can affect the incidence of tax expenditures, but those responses and the resulting changes in incidence are not reflected in this report. For more details, see the section titled “Incidence of Tax Expenditures” in the appendix.
a. The tax expenditure arising from the exclusion for pensions and retirement savings accounts was estimated using a present-value method, which reflects the value of forgone taxes over time that would result from current-year contributions. For more details, see the section titled “How CBO Estimated the Tax Expenditure Created by the Exclusion for Pensions and Retirement Savings Accounts” in the appendix.
b. The estimate of the tax expenditure arising from net preferential tax rates on capital gains and dividends includes the net effect of reduced rates on capital gains and dividends and the surtax on net investment income for high-income taxpayers.
c. The estimates of the tax expenditures arising from the three refundable tax credits—the child tax credit, the earned income tax credit, and the premium tax credit—include the portions of those tax credits that are classified as outlays in the federal budget.
Table 2.
Shares of Major Tax Expenditures, Including Percentiles Within the Highest Quintile, 2019
Percent

Data source: Congressional Budget Office, using estimates from the staff of the Joint Committee on Taxation. See www.cbo.gov/publication/57413#data.
In this analysis, the incidence of tax expenditures is assigned to the taxpayers who would have been directly liable for the relevant taxes if the provisions that generated the tax expenditure did not exist. Moreover, behavioral responses can affect the incidence of tax expenditures, but those responses and the resulting changes in incidence are not reflected in this report. For more details, see the section titled “Incidence of Tax Expenditures” in the appendix.
a. The tax expenditure arising from the exclusion for pensions and retirement savings accounts was estimated using a present-value method, which reflects the value of forgone taxes over time that would result from current-year contributions. For more details, see the section titled “How CBO Estimated the Tax Expenditure Created by the Exclusion for Pensions and Retirement Savings Accounts” in the appendix.
b. The estimate of the tax expenditure arising from net preferential tax rates on capital gains and dividends includes the net effect of reduced rates on capital gains and dividends and the surtax on net investment income for high-income taxpayers.
c. The estimates of the tax expenditures arising from the three refundable tax credits—the child tax credit, the earned income tax credit, and the premium tax credit—include the portions of those tax credits that are classified as outlays in the federal budget.
About 64 million households benefited from the exclusion (see Figure 3). The share of households in each quintile that benefited from it also grew with income, ranging from 12 percent in the lowest quintile to 55 percent in the middle quintile and 74 percent in the highest quintile (see Table 3).
Figure 3.
Number of Households That Benefited From Major Tax Expenditures, 2019
Millions

Data source: Congressional Budget Office, using estimates from the staff of the Joint Committee on Taxation. See www.cbo.gov/publication/57413#data.
In this analysis, the incidence of tax expenditures is assigned to the taxpayers who would have been directly liable for the relevant taxes if the provisions that generated the tax expenditure did not exist. Moreover, behavioral responses can affect the incidence of tax expenditures, but those responses and the resulting changes in incidence are not reflected in this report. For more details, see the section titled “Incidence of Tax Expenditures” in the appendix.
* = Fewer than 2 million households in total benefited from the tax expenditure.
Table 3.
Shares of Households That Benefited From Major Tax Expenditures, 2019
Percent

Data source: Congressional Budget Office, using estimates from the staff of the Joint Committee on Taxation. See www.cbo.gov/publication/57413#data.
In this analysis, the incidence of tax expenditures is assigned to the taxpayers who would have been directly liable for the relevant taxes if the provisions that generated the tax expenditure did not exist. Moreover, behavioral responses can affect the incidence of tax expenditures, but those responses and the resulting changes in incidence are not reflected in this report. For more details, see the section titled “Incidence of Tax Expenditures” in the appendix.
Measured as a share of income before transfers and taxes, the income tax expenditure arising from the exclusion for employment-based health insurance was relatively flat among the middle three quintiles, ranging from 1.1 percent to 1.4 percent of income. Households in the lowest quintile received benefits equal to 0.5 percent of their income, and those in the highest quintile received benefits equal to 0.8 percent of their income (see Figure 4). Households in the top 1 percent of the distribution received benefits equal to 0.2 percent of income (see Table 4).
Figure 4.
Major Tax Expenditures as a Share of Income, 2019
Percentage of Income Before Transfers and Taxes
Data source: Congressional Budget Office, using estimates from the staff of the Joint Committee on Taxation. See www.cbo.gov/publication/57413#data.
In this analysis, the incidence of tax expenditures is assigned to the taxpayers who would have been directly liable for the relevant taxes if the provisions that generated the tax expenditure did not exist. Moreover, behavioral responses can affect the incidence of tax expenditures, but those responses and the resulting changes in incidence are not reflected in this report. For more details, see the section titled “Incidence of Tax Expenditures” in the appendix.
* = less than 0.01 percent.
a. The tax expenditure arising from the exclusion for pensions and retirement savings accounts was estimated using a present-value method, which reflects the value of forgone taxes over time that would result from current-year contributions. For more details, see the section titled “How CBO Estimated the Tax Expenditure Created by the Exclusion for Pensions and Retirement Savings Accounts” in the appendix.
b. The estimate of the tax expenditure arising from net preferential tax rates on capital gains and dividends includes the net effect of reduced rates on capital gains and dividends and the surtax on net investment income for high-income taxpayers.
c. The estimates of the tax expenditures arising from the three refundable tax credits—the child tax credit, the earned income tax credit, and the premium tax credit—include the portions of those tax credits that are classified as outlays in the federal budget.
Table 4.
Major Tax Expenditures as a Share of Income, Including Percentiles Within the Highest Quintile, 2019
Percentage of Income Before Transfers and Taxes

Data source: Congressional Budget Office, using estimates from the staff of the Joint Committee on Taxation. See www.cbo.gov/publication/57413#data.
In this analysis, the incidence of tax expenditures is assigned to the taxpayers who would have been directly liable for the relevant taxes if the provisions that generated the tax expenditure did not exist. Moreover, behavioral responses can affect the incidence of tax expenditures, but those responses and the resulting changes in incidence are not reflected in this report. For more details, see the section titled “Incidence of Tax Expenditures” in the appendix.
a. The tax expenditure arising from the exclusion for pensions and retirement savings accounts was estimated using a present-value method, which reflects the value of forgone taxes over time that would result from current-year contributions. For more details, see the section titled “How CBO Estimated the Tax Expenditure Created by the Exclusion for Pensions and Retirement Savings Accounts” in the appendix.
b. The estimate of the tax expenditure arising from net preferential tax rates on capital gains and dividends includes the net effect of reduced rates on capital gains and dividends and the surtax on net investment income for high-income taxpayers.
c. The estimates of the tax expenditures arising from the three refundable tax credits—the child tax credit, the earned income tax credit, and the premium tax credit—include the portions of those tax credits that are classified as outlays in the federal budget.
Two factors explain that distributional pattern. First, although the likelihood of having employment-based health insurance increases with income, premium amounts are more evenly distributed for those who have such insurance. Second, the income tax rate rises with the income distribution, so the tax savings from each dollar excluded increases along with the tax rate.
At $121 billion, the payroll tax expenditure arising from the exclusion for employment-based health insurance was nearly as large as the income tax expenditure in 2019. The payroll tax expenditure was more evenly distributed than was the income tax expenditure because payroll taxes generally rise less quickly with income than income taxes do. CBO estimates that 28 percent of that tax expenditure accrued to households in the highest quintile, 30 percent to the fourth quintile, 23 percent to the middle quintile, and 18 percent to the two lowest quintiles combined.
Measured as a share of income, the payroll tax expenditure was relatively flat among the middle three quintiles. Households in those quintiles received benefits equal to between 1.1 percent and 1.3 percent of their income. Households in the lowest quintile received benefits equal to 0.8 percent of their income, whereas those in the highest quintile received benefits equal to 0.4 percent of their income.
Exclusion for Pensions and Retirement Savings Accounts
The federal tax system treats retirement savings more favorably than it does other forms of savings. Certain contributions to pension plans and retirement accounts can be excluded from income taxes and payroll taxes when they are made, and investment earnings in those plans and accounts are generally not subject to individual income taxes when they accrue. Instead, taxes are deferred—that is, they are paid when withdrawals are made from the accounts, typically during retirement. Thus, one key benefit of the exclusion for pensions and retirement savings accounts is that it enables taxpayers to save for retirement at the before-tax rate of return.13
In this report, CBO combined several tax expenditures related to multiple types of pension plans and retirement savings accounts—such as defined-benefit and defined-contribution employer plans, individual retirement arrangements (IRAs), Roth plans, and Keogh plans—in its estimate of the tax expenditure arising from pensions and retirement savings accounts.
For the purposes of this analysis, CBO estimated the tax expenditure for pension and retirement contributions using a present-value method, which reflects the value of forgone taxes over time that would result from current-year contributions. That method compares the current and future taxes paid for retirement contributions made today with the current and future taxes that would have been paid on an equivalent investment in a taxable account. Some analysts use a cash-flow method instead, which estimates the tax expenditure for pension contributions as the difference between the current tax treatment and an alternative one in which there was no deduction for contributions, in which investment earnings in existing accounts were taxed, and in which withdrawals from existing accounts were not taxed. Because such retirement savings accounts allow the taxpayer to save at the before-tax rate of return, the present-value estimate better reflects the economic benefit of altering the timing of taxes on retirement income. (See the appendix for a discussion of the differences between the present-value method and the cash-flow method.)
The tax expenditure arising from the exclusion and deferrals for the contributions and earnings associated with pensions and retirement savings accounts is the second-largest tax expenditure considered in this analysis. CBO estimates that it totaled $276 billion in 2019, of which $202 billion constitutes the income tax expenditure and $74 billion constitutes the payroll tax expenditure.14 Those estimates reflect the present value of tax savings attributable to contributions made in 2019.
Most of the benefits of the exclusion for pensions and retirement savings accounts accrued to higher-income households. Households in the highest quintile received more than 60 percent of the benefits of the income tax expenditure. The two lowest quintiles together received less than 5 percent of the benefits.
About 62 million households benefited from the tax expenditure, and the share of households that benefited increased with income. CBO estimates that 19 percent of households in the lowest quintile, 46 percent of households in the middle quintile, and 77 percent of households in the highest quintile benefited from the tax expenditure. CBO estimates that, in 2019, households in the lowest quintile received benefits from the income tax expenditure equal to 0.2 percent of their income before transfers and taxes, whereas those in the middle quintile and the highest quintile received benefits equal to 0.8 percent and 1.5 percent of such income, respectively.
Higher-income taxpayers tend to benefit more from the exclusion for pensions and retirement savings accounts for three main reasons. First, such taxpayers are more likely to have employers who offer pension plans and who are also more likely to contribute to retirement savings accounts. Second, the generosity of such plans and contributions increases with income, although that effect is limited by caps on contributions and antidiscrimination rules that prevent employers from making retirement plans significantly more valuable for highly compensated employees than for other employees. Finally, higher-income taxpayers face higher marginal tax rates—that is, the tax rate that would apply to an additional dollar of income—which increases the value of the tax expenditure for each additional dollar of their retirement savings.
The payroll tax expenditure arising from the exclusion of contributions to pension and retirement savings plans was more evenly distributed than was the corresponding income tax expenditure because payroll taxes generally increase more slowly with income than income taxes do. Households in the highest quintile received 45 percent of the benefits of the payroll tax expenditure, CBO estimates, compared with 63 percent of the benefits of the income tax expenditure. The two lowest quintiles together received 10 percent of the benefits of the payroll tax expenditure, compared with less than 5 percent of the benefits of the income tax expenditure. When measured as a share of income, the payroll tax expenditure arising from the exclusion for pensions and retirement savings accounts was relatively evenly distributed. Each of the five quintiles received benefits equal to between 0.4 percent and 0.7 percent of their income.
Net Preferential Tax Rates on Capital Gains and Dividends
Long-term capital gains (that is, the profit from the sale of an asset that was held for longer than one year) and certain dividends are taxed at lower rates than are other forms of income. In 2019, income from those long-term gains and dividends was subject to a maximum marginal rate of 20 percent for taxpayers with taxable income above $434,550 ($488,850 for joint filers). In addition, taxpayers with income above certain thresholds—$200,000 for single filers and $250,000 for joint filers—faced a surtax equal to 3.8 percent of their investment income (including capital gains and dividend income, as well as interest income and some passive business income). The surtax offsets some of the benefits associated with the lower tax rates on long-term capital gains and dividends.15
The tax expenditure arising from the net preferential rate on long-term capital gains and dividends totaled $140 billion in 2019, CBO estimates.16 CBO’s estimates of that tax expenditure comprise the net effects of both the reduced rates on capital gains and dividends and the portion of the surtax that falls on those gains and dividends. The former amounted to $174 billion in 2019, and the latter amounted to $34 billion, CBO estimates.
Ninety-five percent of the benefits from the net preferential rates on capital gains and dividends accrued to households in the highest quintile in 2019—75 percent of them to households in the top 1 percent of the income distribution. Although only about half of the 26 million households that benefit from this tax expenditure are in the highest quintile, those households have much higher amounts of capital gains and dividends. CBO estimates that the tax expenditure equals 1.5 percent of income before transfers and taxes for households in the highest quintile and 4.1 percent of income for households in the top 1 percent, for two key reasons. First, the largest share of capital gains realizations and dividends accrues to those households. Second, those households are typically in the highest tax bracket for ordinary income. As a result, the tax expenditure estimate for those households typically reflects a larger difference between the ordinary rate and the lower rate on capital gains and dividends.
Child Tax Credit
In 2019, taxpayers with children under age 17 were eligible to receive a $2,000 credit per child, up to $1,400 of which was refundable. An additional, nonrefundable $500 credit was available for older dependent children and other dependent relatives.17 The credit was reduced for taxpayers with income above $200,000 ($400,000 for joint filers). The credit is currently scheduled to shrink to $1,000 in 2026, when the eligibility for it is also scheduled to change to span a narrower range of income.
CBO estimates that the tax expenditure arising from the child tax credit totaled $118 billion in 2019. The credit was relatively evenly distributed. Households in the four lower quintiles received between 19 percent and 23 percent of the total benefits; those in the highest quintile received 14 percent of the benefits, of which 8 percent went to households in the 81st to 90th percentiles. Thirty-nine million households benefited from the expenditure. Between 29 percent and 37 percent of households in each of the four lower quintiles benefited, as did 20 percent of households in the highest quintile.
The credit accounted for 3.6 percent of income before transfers and taxes for households in the lowest quintile, 2.0 percent of such income for households in the second quintile, and 1.2 percent for those in the middle quintile. Because the credit had a fixed maximum value, it constituted a smaller share of income as income increased, even among taxpayers who received the full credit (in contrast to exclusions or deductions, which are uncapped and can rise with income). As a result, the benefits accounted for only 0.8 percent of income for households in the fourth quintile and 0.2 percent of income for those in the highest quintile.
Earned Income Tax Credit
A fully refundable credit is available to low-income workers, which increases up to a certain level of income depending on a worker’s marital status and number of children. The maximum credit for taxpayers with two qualifying children was $5,828 in 2019. The credit was reduced for taxpayers at higher income levels and was unavailable to those with income above certain thresholds.18
CBO estimates that the tax expenditure arising from the earned income tax credit totaled $70 billion in 2019. More than half of households in the lowest quintile benefited from the credit, and CBO estimates that 56 percent of its benefits accrued to those households. For those households, the credit equaled 6.5 percent of their income before transfers and taxes. One-quarter of the benefits from the credit accrued to households in the second quintile, equaling 1.3 percent of income before transfers and taxes for those households. In contrast, about 8 percent of the benefits from the credit accrued to households in the two highest quintiles—largely because some low-income taxpayers who qualify for the credit live in high-income households.
Premium Tax Credit
Under current law, subsidies for health insurance obtained through the marketplaces established under the Affordable Care Act are primarily provided through premium tax credits. In 2019, those credits were available to people with a modified adjusted gross income between 100 percent and 400 percent of the federal poverty level (FPL), and who were lawfully present in the United States, were not eligible for public coverage (such as Medicaid or the Children’s Health Insurance Program), and who did not have an affordable offer of employment-based coverage.19 The value of the credit varies on the basis of income, of the chosen health insurance plan, and of the cost of a benchmark plan in the same local market.
CBO estimates that the total tax expenditure arising from the premium tax credit was $53 billion in 2019. The credit was designed to assist lower- and middle-income people, but not those toward the very bottom of the income distribution, who are typically eligible for Medicaid. Eighty-four percent of the benefit from the premium tax credit went to households in the lower three quintiles: 35 percent to those in the second quintile, and 29 percent and 19 percent to the lowest and middle quintiles, respectively. Nearly 5 million of the 6 million households that benefited from the expenditure came from the lower three quintiles. The benefits equaled 2.6 percent of income before transfers and taxes for households in the lowest quintile, 1.3 percent for those in the second quintile, and 0.5 percent for those in the middle quintile.
Charitable Contribution Deduction
Taxpayers who itemize their deductions can deduct contributions to eligible charities and nonprofit organizations from their taxable income, subject to some limitations.
The deduction for charitable contributions was the largest itemized deduction in the individual income tax system in 2019. The tax expenditure arising from that deduction was an estimated $43 billion. Ninety-three percent of its benefits accrued to households in the highest quintile, including 63 percent to households in the top 1 percent of the income distribution.
Higher-income households are more likely to claim a deduction for their contributions to charity—38 percent of households in the highest quintile claimed the deduction in 2019, compared with 14 percent in the fourth quintile and 6 percent in the middle quintile. CBO estimates that, in 2019, the tax expenditure equaled 0.1 percent of income before transfers and taxes for households in the fourth quintile, 0.5 percent for those in the highest quintile, and 1.1 percent for the top 1 percent of the distribution. Among households that claim the deduction, higher-income households tend to deduct larger amounts. Because they are typically in higher tax brackets, those households also receive a larger proportional benefit for every dollar of charitable contribution.
Qualified Business Income Deduction
Owners of certain pass-through businesses (such as S corporations, partnerships, and sole proprietorships) can deduct up to 20 percent of their net income from the business, depending on the amount of the income and the size and nature of the business. That deduction is scheduled to expire in 2026.
Although the qualified business income deduction is structured as a deduction, it is similar to the net preferential tax rate on capital gains and dividends because it is equivalent to a reduced tax rate on a certain type of income and applies only to a taxpayer’s positive qualified business income. In addition, it differs in two important ways from the deductions for charitable contributions, mortgage interest, and state and local taxes paid. First, it is available to taxpayers whether or not they itemize their deductions. Second, it allows taxpayers to deduct a portion of their income without first requiring them to spend that income on any particular item.
Because higher-income households tend to have more qualifying income, benefits from the qualified business income deduction were skewed toward the top of the distribution. The tax expenditure arising from that deduction totaled $41 billion in 2019, CBO estimates, of which 88 percent accrued to households in the highest quintile, including 50 percent that accrued to households in the top 1 percent of the distribution. Nearly two-thirds of the 15 million households that benefited from the deduction were in the two highest quintiles in 2019, according to CBO’s estimates. The tax expenditure equaled 0.1 percent of income for households in the middle quintile and in the fourth quintile, 0.4 percent for those in the highest quintile, and 0.8 percent for those in the top 1 percent of the distribution.
Exclusion of Capital Gains on Assets Transferred at Death
Increases in the value of an asset beyond its purchase value (or cost basis) are exempt from the tax on capital gains when the asset is transferred to heirs upon the death of its owner. When the asset is transferred, the cost basis is adjusted to the current market value. As a result, heirs are not liable for taxation on increases in value that occurred before they acquired the asset.20
The tax expenditure arising from the exclusion of capital gains on assets transferred at death totaled about $39 billion in 2019, CBO estimates. The benefits from the exclusion were skewed toward the top of the income distribution: CBO estimates that 56 percent of the benefits accrued to households in the highest quintile (including 18 percent that accrued to households in the top 1 percent of the distribution), and 19 percent accrued to households in the fourth quintile.21 The exclusion largely benefits taxpayers with a high net worth, who tend to be in households in the upper portion of the income distribution.22
Because the exclusion is only available when a taxpayer dies and has assets to transfer, very few households benefit from it in any given year. About 1 percent of households in every quintile (except the lowest quintile) used the exclusion in 2019. However, the value of the benefit increases with the value of assets being transferred, so most of the benefits from the exclusion accrue to households with a high net worth, which tend to be in the upper portion of the income distribution.
Exclusion of Social Security and Railroad Retirement Benefits
Payments of Social Security and Railroad Retirement benefits are funded by payroll taxes, and the amount of the benefits is determined in part by the amounts that employees and employers contribute during the period of employment. Both the employer and the employee pay payroll taxes to fund an employee’s Social Security (and Railroad Retirement benefit) payments. Under current law, most Social Security benefits are exempt from taxation. Currently, Social Security recipients only pay taxes on a portion of their benefits, and only if their total income exceeds a certain threshold.23 The benefits of recipients who do not exceed that threshold are not taxed, and that loss of revenues is considered a tax expenditure. Under the reference income tax system, the portion of Social Security benefits that cannot be traced back to a recipient’s contributions would be taxable.
The tax expenditure arising from the exclusion of Social Security and Railroad Retirement benefits totaled about $37 billion in 2019, accruing to about 23 million households. That exclusion almost exclusively benefited middle-income households, CBO estimates, with 85 percent going to those in the middle three income quintiles. Higher-income taxpayers benefit little from the exclusion because they are required to include most of their Social Security benefits in their taxable income under current law. Lower-income taxpayers also benefit little from the exclusion because the standard deduction already excludes a large portion of those benefits from their taxable income.
Exclusion of Capital Gains on the Sale of Principal Residences
In 2019, taxpayers could exclude from their taxable income up to $250,000 (or $500,000 for a married couple filing jointly) of the capital gains arising from the sale of their primary residence, with some limitations.
CBO estimates that the tax expenditure totaled about $35 billion in 2019, 70 percent of which accrued to households in the two highest quintiles, including 5 percent that accrued to households in the top 1 percent of the distribution.24 About 5 million households benefited from the exclusion in 2019. The share of households that benefited in each quintile was relatively flat throughout the income distribution: 2 percent of households in the lowest quintile benefited from the expenditure, as did 4 percent of households in the middle quintile and 6 percent of those in the highest quintile. A larger share of the total tax expenditure accrues to higher-income taxpayers because they tend to realize larger gains when their homes are sold. However, the share of the tax expenditure decreases with income within the highest quintile, largely because the exclusion is capped (at $250,000 for a single filer and $500,000 for a married couple filing jointly).
Mortgage Interest Deduction
Under current law, taxpayers who elect to itemize their deductions are typically allowed to deduct from taxable income the interest paid on the mortgage of their primary and secondary residences. In 2019, the deduction was limited to the interest paid on qualifying mortgage debt up to $750,000. The limit is scheduled to increase to $1 million in 2026, when many of the individual income tax provisions of the 2017 tax act are scheduled to expire.
The tax expenditure arising from the mortgage interest deduction on owner-occupied residences totaled $28 billion in 2019. Households in the highest quintile received 84 percent of the benefits from the deduction that year, including 25 percent that accrued to the top 1 percent of the distribution. CBO estimates that 15 million households benefited from the expenditure in 2019, with the benefits skewed toward the top of the distribution: 36 percent of households in the highest quintile benefited from the tax expenditure, compared with 14 percent of households in the fourth quintile and 6 percent of households in the middle quintile. The mortgage interest deduction equaled 0.3 percent of income before transfers and taxes for households in the highest quintile and 0.1 percent of such income for those in the fourth quintile, CBO estimates.
Taxpayers in higher-income households receive a larger share of the mortgage interest deduction than do other households for three main reasons. Those taxpayers are more likely to itemize their deductions; they tend to hold larger mortgages; and the value of the tax expenditure is higher for them because they are typically in higher tax brackets.
State and Local Tax Deduction
In 2019, taxpayers who elected to itemize their deductions could deduct from their taxable income the taxes they paid to state and local governments. The deduction was capped at $10,000 that year but is scheduled to become unlimited in 2026.
CBO estimates that the tax expenditure arising from the state and local tax deduction totaled $22 billion in 2019. Because higher-income households pay more state and local taxes than other households do, they are more likely to deduct those taxes and to deduct higher amounts when they do. About 94 percent of the benefits from the tax expenditure accrued to households in the two highest quintiles in 2019. Seventeen percent of households in the fourth quintile, and 41 percent of households in the highest quintile, benefited from the tax expenditure. The deduction accounted for 0.1 percent of income before transfers and taxes for households in the fourth quintile and 0.2 percent for those in the highest quintile.
The Distribution of Major Tax Expenditures in the Individual Income Tax System in Total
In total, the benefits from the major tax expenditures examined in this report were distributed unevenly across the income scale in 2019. When measured in dollars, the combined benefits from the tax expenditures accrued more to higher-income households than to lower-income ones. However, when measured relative to income before transfers and taxes, the combined benefits were greater for lower-income households than for higher-income ones. If the effects of payroll taxes were excluded from CBO’s estimates, the distribution of benefits would be slightly more evenly distributed.25
Distribution in Dollars
In 2019, higher-income households benefited more from the major tax expenditures, when measured in dollars, than did lower-income households. CBO estimates that 50 percent of the total benefits of the income tax expenditures accrued to households in the highest quintile of the income distribution, 13 percent accrued to those in the middle quintile, and 9 percent accrued to those in the lowest quintile (see Figure 5). The payroll tax expenditures, which represent a smaller total value, were more evenly distributed: 34 percent accrued to households in the highest quintile, 21 percent accrued to households in the middle quintile, and 4 percent accrued to households in the lowest quintile.
Figure 5.
Shares of Combined Major Tax Expenditures, 2019
Percent

Data source: Congressional Budget Office, using estimates from the staff of the Joint Committee on Taxation. See www.cbo.gov/publication/57413#data.
In this analysis, the incidence of tax expenditures is assigned to the taxpayers who would have been directly liable for the relevant taxes if the provisions that generated the tax expenditure did not exist. Moreover, behavioral responses can affect the incidence of tax expenditures, but those responses and the resulting changes in incidence are not reflected in this report. For more details, see the section titled “Incidence of Tax Expenditures” in the appendix.
The combined estimates include interactions among the tax expenditures that would occur if the tax expenditures were simultaneously eliminated, except the tax expenditure arising from the exclusion for pensions and retirement savings accounts. Although that tax expenditure is included in the combined estimates, the effect of its interaction with the other tax expenditures is omitted because it is estimated using a present-value method, which reflects the value of forgone taxes over time that would result from current-year contributions. For more details, see the section titled “How CBO Estimated the Tax Expenditure Created by the Exclusion for Pensions and Retirement Savings Accounts” in the appendix.
The estimate of the tax expenditure arising from net preferential tax rates on capital gains and dividends includes the net effect of reduced rates on capital gains and dividends and the surtax on net investment income for high-income taxpayers.
The estimates of the tax expenditures arising from the three refundable tax credits—the child tax credit, the earned income tax credit, and the premium tax credit—include the portions of those tax credits that are classified as outlays in the federal budget.
Benefits were not evenly distributed within the highest quintile. About 18 percent of the benefits from the income tax expenditures accrued to households in the top 1 percent of the distribution, 11 percent accrued to households in the 96th to 99th percentiles, 8 percent accrued to households in the 91st to 95th percentiles, and 12 percent accrued to households in the 81st to 90th percentiles. Of the payroll tax expenditures, 1 percent accrued to households in the top 1 percent of the distribution, and 19 percent accrued to households in the 81st to 90th percentiles.
Distribution as a Share of Income
Although about 8 percent of the benefits of the income and payroll tax expenditures examined here accrued to households in the lowest quintile in 2019, those households received an even smaller share of income. CBO estimates that in 2018, the most recent year for which the agency estimated the distribution of household income, households in the lowest quintile received less than 4 percent of total income before transfers and taxes.26
As a result, when tax expenditures are measured as a share of income before transfers and taxes, they benefit households in the two lowest quintiles more than they do households in the rest of the income distribution. CBO estimates that, in 2019, the benefits accruing from the tax expenditures analyzed in this report (including both income tax and payroll tax expenditures) equaled 16 percent of income for households in the lowest quintile, 9 percent of income for households in the second quintile, 8 percent of income for households in the middle quintile, and 7 percent of income for households in the two highest quintiles (see Figure 6). The shares were similar among income groups within the highest quintile, with each group receiving benefits equal to between 6.0 percent and 7.5 percent of income.
Figure 6.
Combined Major Tax Expenditures as a Share of Income, 2019
Percentage of Income Before Transfers and Taxes

Data source: Congressional Budget Office, using estimates from the staff of the Joint Committee on Taxation. See www.cbo.gov/publication/57413#data.
In this analysis, the incidence of tax expenditures is assigned to the taxpayers who would have been directly liable for the relevant taxes if the provisions that generated the tax expenditure did not exist. Moreover, behavioral responses can affect the incidence of tax expenditures, but those responses and the resulting changes in incidence are not reflected in this report. For more details, see the section titled “Incidence of Tax Expenditures” in the appendix.
The combined estimates include interactions among the tax expenditures that would occur if the tax expenditures were simultaneously eliminated, except the tax expenditure arising from the exclusion for pensions and retirement savings accounts. Although that tax expenditure is included in the combined estimates, the effect of its interaction with the other tax expenditures is omitted because it is estimated using a present-value method, which reflects the value of forgone taxes over time that would result from current-year contributions. For more details, see the section titled “How CBO Estimated the Tax Expenditure Created by the Exclusion for Pensions and Retirement Savings Accounts” in the appendix.
The estimate of the tax expenditure arising from net preferential tax rates on capital gains and dividends includes the net effect of reduced rates on capital gains and dividends and the surtax on net investment income for high-income taxpayers.
The estimates of the tax expenditures arising from the three refundable tax credits—the child tax credit, the earned income tax credit, and the premium tax credit—include the portions of those tax credits that are classified as outlays in the federal budget.
Distribution Excluding Payroll Taxes
In 2019, the forgone payroll tax revenues from tax expenditures were relatively evenly distributed as a share of income in the four lowest quintiles of the distribution, but they represented a smaller share of income in the highest quintile and a much smaller share in the top 5 percent of the income distribution. Thus, the shares of the benefits from tax expenditures accruing to each income group rose more sharply with income when only income taxes—rather than both income taxes and payroll taxes—are considered. Still, tax expenditures from the individual income tax alone provided the greatest benefit as a share of income to households in the lowest quintile, consistent with the results reported here for tax expenditures from income and payroll taxes together.
1. The exception to that approach involves the refundable portion of tax credits, which is reported in the budget as mandatory spending.
2. The analysis in this report does not include corporate tax expenditures.
3. For a summary of how the Joint Committee on Taxation analyzes tax expenditures, see Joint Committee on Taxation, Background Information on Tax Expenditure Analysis and Historical Survey of Tax Expenditure Estimates, JCX-18-15 (February 6, 2015), www.jct.gov/publications/2015/jcx-18-15/. For the most recent list of JCT’s estimates of tax expenditures, see Joint Committee on Taxation, Estimates of Federal Tax Expenditures for Fiscal Years 2020–2024, JCX-23-20 (November 5, 2020), www.jct.gov/publications/2020/jcx-23-20/.
4. Despite income restrictions, households in the upper portion of the income distribution may receive the credits in certain cases because they include multiple families or tax filers. For example, a household may comprise a family consisting of a lower-income parent with two children who is eligible for the earned income and child tax credit and a higher-income adult whose income places the entire household near the top of the income distribution.
5. The estimates for those three credits include the refundable portions of the credits.
6. A provision that generates greater revenues than would occur under normal tax law is sometimes referred to as a negative tax expenditure.
7. For more details about the effects of the mortgage interest deduction and other tax expenditures, see Senate Committee on the Budget, Tax Expenditures: Compendium of Background Material on Individual Provisions, S. Prt. 116-53 (December 1, 2020), https://go.usa.gov/xMy5v.
8. Provisions that reduce the payroll tax base also reduce future Social Security benefits. Because those future benefits tend to be distributed more progressively than current payroll taxes are (that is, the benefits are a larger percentage of lifetime earnings for workers with lower lifetime earnings), an analysis that incorporated those exclusions’ effects on future Social Security benefits, as well as on payroll and income taxes, would show net benefits to be more progressive than does the present analysis, which considers only the effects on current taxes. For more details, see the appendix.
9. For details about the history of tax expenditures, see Joint Committee on Taxation, Background Information on Tax Expenditure Analysis and Historical Survey of Tax Expenditure Estimates, JCX-18-15 (February 6, 2015), www.jct.gov/publications/2015/jcx-18-15/.
10. Recent legislation enacted in response to the pandemic also created several large, temporary tax expenditures, most notably the credits from recovery rebates for individuals and a temporary expansion of the child tax credit. Created by legislation enacted in 2020, those tax expenditures are not reflected in this report.
11. For the complete list of the tax expenditures that JCT estimates, see Joint Committee on Taxation, Estimates of Federal Tax Expenditures for Fiscal Years 2020–2024, JCX-23-20 (November 5, 2020), www.jct.gov/publications/2020/jcx-23-20/.
12. The estimates of the tax expenditure created by the exclusion of employment-based health insurance in this analysis differ from the tax value of that exclusion, which appears in some other CBO reports. The tax expenditure represents the change in tax revenues that would occur if the amount of excluded compensation was taxed, whereas the tax value represents the change in tax revenues that would occur if the exclusion was repealed and the total compensation paid by the employer (including the employer’s payroll taxes) remained constant because wages were increased. Neither measure reflects employees’ behavioral responses to the change.
13. An alternative type of retirement savings account is a Roth plan. Although contributions to a Roth plan are made with after-tax income, the earnings on the investments in such a plan, and any withdrawals from it, are not taxed. Like traditional retirement savings plans, Roth plans allow taxpayers to save for retirement at the before-tax rate of return.
14. The payroll tax expenditure is created because employer contributions to pension and retirement savings accounts are not subject to the payroll tax. Employee contributions are subject to the payroll tax and therefore do not contribute to the estimate of the payroll tax expenditure.
15. The estimates in this report do not account for corporate taxation and do not distinguish between real and inflationary capital gains. See Box 1 for details about how that treatment differs from the measurement of tax expenditures based on a comprehensive income tax.
16. As is true of many of the other tax provisions that create the tax expenditures in this report, changes to the rate at which capital gains and dividends are taxed could cause taxpayers to alter their behavior regarding saving and investing. For example, higher tax rates on capital gains could cause taxpayers to realize fewer capital gains. The estimates presented here do not account for such behavior changes. For more details, see the section titled “Incidence of Tax Expenditures” in the appendix.
17. As part of the American Rescue Plan, a larger credit amount was temporarily made available to taxpayers with income below $75,000 ($150,000 for joint filers) in 2021. In addition, the credit was made fully refundable.
18. The earned income tax credit is much larger for families with children than for childless workers, and the child tax credit is only available to families with children. As a result, the estimates of the distributions of those credits depend heavily on the distribution of families with children throughout the income scale. When ranking the population by income, CBO adjusts income for household size; as a result, more households with children are included in the lowest income quintile. Without such an adjustment, the tax credits would appear to be less progressive than they do in this report. For more information about how CBO ranks households and adjusts for household size, see Congressional Budget Office, The Distribution of Household Income, 2018 (August 2021), www.cbo.gov/publication/57061.
19. In 2019, the threshold for determining the affordability of an offer of employment-based health coverage was set at 9.86 percent of income for a single plan—that is, a plan that covers one person. The American Rescue Plan Act of 2021 (Public Law 117-2), which was enacted in March 2021, included provisions that temporarily expanded the premium tax credit in 2021 and 2022. The law increased tax credits for those with income between 100 percent and 400 percent of the FPL. It also extended eligibility for the credits to those with income at or above 400 percent of the FPL, ensuring that they do not pay more than 8.5 percent of their income for a benchmark plan. Those changes are not included in the estimates of the tax expenditures provided in this report.
20. The estimates in this report do not account for corporate taxation and do not distinguish between real and inflationary capital gains. See Box 1 for details about how that treatment differs from the measurement of tax expenditures based on a comprehensive income tax.
21. In this report, the estimates of tax expenditures arising from capital gains exclusions—that is, the exclusion of capital gains on assets transferred at death and of capital gains on the sale of principal residences—rely on estimates of lifetime unrealized capital gains, which are not available in the tax data. Although CBO includes realized capital gains in the measure of income that it uses to rank households and place them in different income groups, estimates of accrued capital gains are not included in that measure. As a result, the households that benefit from those tax expenditures are likely to appear lower in the income distribution than they would be if unrealized gains were included. However, other households with unrealized capital gains who do not avail themselves of either of those exclusions also likely appear lower in the distribution, so the amount of reranking that would occur if unrealized capital gains were added to the income measure is uncertain.
22. There is uncertainty about whether the incidence of this tax expenditure falls on decedents or their heirs. CBO allocates the tax to decedents. In addition, as is the case with other taxes on capital income, the ways in which the exclusion affects saving behavior could have broader effects on labor and capital income. For more details, see the section titled “Incidence of Tax Expenditures” in the appendix.
23. In 2019, single filers were required to pay taxes on up to 50 percent of their benefits if their income was between $25,000 and $34,000; they were required to pay taxes on up to 85 percent of their benefits if their income was over $34,000.
24. The estimates presented here do not distinguish between real and inflationary capital gains. See Box 1 for details about how that treatment differs from the measurement of tax expenditures based on a comprehensive income tax.
25. When preparing the combined estimates of the tax expenditures in this report, CBO accounted for the interactions among the tax expenditures that would occur if certain tax expenditures were eliminated simultaneously. One exception is the exclusion for pensions and retirement savings accounts. Because CBO uses a present-value method in its estimates of that tax expenditure, its interaction with the other tax expenditures is not included. Instead, the estimate of that tax expenditure is added to the combined estimate of the other tax expenditures. For a discussion about the types of interactions that can occur among tax expenditures, see the section titled “Interactions Among Tax Expenditures” in the appendix.
26. See Congressional Budget Office, The Distribution of Household Income, 2018 (August 2021), www.cbo.gov/publication/57061.
AppendixAnalytic Method and Additional Characteristics of Tax Expenditures
This appendix provides details about how the Congressional Budget office estimated the distribution of tax expenditures presented in this report. The appendix also provides information about the differences between the present analysis and CBO’s previous work on the distribution of tax expenditures; the agency’s present-value approach for estimating the exclusion for pensions and retirement savings accounts (a present value is a single number that expresses a flow of current and future payments in terms of a lump sum paid today); issues related to the incidence of tax expenditures; how tax expenditures can interact with each other; and the agency’s analysis of payroll taxes, which excludes effects on future Social Security benefits related to taxes paid.
Analytic Method
To evaluate the distribution of major tax expenditures, CBO used a sample of income tax returns filed in 2013. That sample was the most recent public-use data with detailed information about tax returns that was available when this analysis began.1 CBO used its microsimulation tax model to adjust the sample of returns from 2013 to account for changes in the population and the economy between 2013 and 2019, which yielded a sample of tax returns for 2019 that reflected the income and demographic characteristics of the population in that year. The agency used a measure of income before transfers and taxes that comprises both market income (including labor income, business income, and capital income—the latter counting capital gains) and social insurance benefits (such as Social Security and Medicare).2
For its analysis, CBO divided the U.S. population into income groups, such as the lowest quintile (that is, the lowest fifth) or the top 1 percent.3 In constructing those income groups, households (all people living in a single housing unit, regardless of their relationships) were ranked by income before transfers and taxes, adjusted for household size, which reflects the fact that larger households need more income than smaller ones do to achieve the same economic status. CBO adjusted income for household size by dividing household income by an adjustment factor equal to the square root of the number of people in the household, counting adults and children equally. That adjustment reflects the agency’s assessment that each additional person increases a household’s needs but at a decreasing rate.4
In CBO’s analysis, families or individuals who live together but file separate tax returns were treated as a single household to reflect the fact that they share resources. As a result, the distribution of tax expenditures among households differs from the distribution of tax expenditures among tax-filing units. For example, someone who qualifies for a tax expenditure, such as the earned income tax credit (EITC), on the basis of the income of his or her tax-filing unit may live in a household that includes people in higher-income tax-filing units. That pattern would make the distribution of benefits from the EITC less progressive on a household basis than on the basis of tax-filing units.
CBO simulates what the tax liabilities would have been for each taxpayer in 2019 if the provisions that created tax expenditures were eliminated; but the analysis does not account for any change in taxpayers’ behavior in response to eliminating those provisions. (See the section titled “Incidence of Tax Expenditures” in this appendix for more details about the potential effects of taxpayers’ behavior.)
Most tax expenditures can be directly computed from the information available on tax returns, but some must be calculated using external data sources. To estimate the effect on tax liabilities of the exclusion for employment-based health insurance, for example, CBO used estimates from its health insurance simulation model. That model provided the probabilities of people having employment-based health insurance (as well as the value of that insurance) on the basis of each taxpayer’s age, sex, marital status, number of dependents, employment, and income. Also, CBO estimated pension contributions from employers and employees using tabulations from the Survey of Consumer Finances. Those tabulations included the probabilities of people participating in various forms of retirement savings plans, as well as average contributions and balances estimated on the basis of income, age, and marital status. Those parameters were then applied to the income tax data. CBO used a similar method to estimate capital gains from unrealized gains at death and the sale of owner-occupied housing.
Although the data CBO used in its analysis contained information about income from pass-through businesses, those data did not contain information about which businesses were eligible for the qualified business income deduction. The agency therefore estimated the effects of that deduction by applying it to all the pass-through income of taxpayers with income below certain thresholds that limit who can claim the deduction. CBO also applied a smaller deduction to the pass-through income of taxpayers with income above those thresholds, so that the total value of the tax expenditure in the extrapolated 2019 data set matched the agency’s estimate of the total for that year.
Each estimated tax expenditure for each taxpayer was scaled so that, for a given expenditure, the sum of the estimates among all taxpayers was equal to the aggregate amount of that tax expenditure in 2019, as estimated by the staff of the Joint Committee on Taxation (JCT).5 JCT’s estimates are calculated on the basis of fiscal years; CBO adjusted those estimates to obtain calendar-year totals for the estimates in this report.
In this report, CBO follows JCT’s method of estimating each tax expenditure “as the difference between tax liability under present law and the tax liability that would result from a recomputation of tax without benefit of the tax expenditure provision.”6 In that way, it is assumed that taxpayers would take advantage of any of the remaining tax expenditure provisions that apply to the income or the expenses associated with the tax expenditure in question. For example, the tax expenditure created by the exclusion for employment-based health insurance is estimated as the difference in tax liability that would result if the exclusion was repealed but taxpayers were still allowed to claim the next-best tax treatment available for health insurance contributions under current law. For some taxpayers, that next-best treatment would be to claim those contributions as an itemized medical deduction.
How This Report Differs From CBO’s 2013 Report on Tax Expenditures
In 2013, CBO published a report on the distribution of the largest tax expenditures in that year. Although the present report is an update to that earlier one, there are three important differences in the analysis. First, CBO has updated its distributional framework so that households are grouped on the basis of income before transfers and taxes, which comprises market income (including labor income, business income, and capital income—the latter counting capital gains) and social insurance benefits (such as Social Security and Medicare).7 In the previous report, households were grouped on the basis of their before-tax income, which also included means-tested transfers. Furthermore, when reporting tax expenditures as a share of income, the previous report used after-tax income, whereas this report uses income before transfers and taxes to be consistent with the measure of income used to rank households in the distributional framework.
Second, legislative changes since 2013 have changed the set of major tax expenditures being examined. For example, new tax expenditures have been added, such as the premium tax credit and the qualified business income deduction. In addition, the size and distribution of nearly all existing tax expenditures were altered by the 2017 tax act, which significantly changed the tax system.
Finally, this analysis reflects economic changes since 2013, which altered the distribution of income. Most notably, a larger share of income was concentrated at the top of the distribution in 2019 than in 2013. However, this analysis does not reflect any economic or legislative changes to the economy since 2019.
How CBO Estimated the Tax Expenditure Created by the Exclusion for Pensions and Retirement Savings Accounts
Provisions related to pensions and retirement savings accounts affect the timing and amount of income subject to income taxes and payroll taxes in several ways. First, certain contributions to pension and retirement plans are excluded from taxation when they are made. (Generally, contributions from employers are excluded from both income taxes and payroll taxes; most contributions from employees are excluded from income taxes.) Second, the investment earnings on balances held inside pension and retirement accounts—the largest component of the tax expenditure—are untaxed. Finally, pension benefits and distributions from retirement accounts that were not previously taxed are subject to income taxes upon withdrawal; that component partially offsets the first two components.8
Most tax expenditures, including the one created by the exclusion for pensions and retirement savings accounts, are typically estimated using a cash-flow method. That method measures the effect of all current and past tax-preferred retirement contributions on current-year tax liability as the difference between the current tax treatment and an alternative tax treatment. Under the alternative tax treatment, there is no deduction for contributions, investment earnings in existing accounts are taxed, and withdrawals from existing accounts are not taxed. Estimating the tax expenditure using the cash-flow method requires estimating the unobserved asset appreciation and the corresponding rates at which that investment income would be taxed.
However, CBO used a present-value method in the current analysis.9 That method evaluates the entire future stream of tax payments for an investment in a pension account (in general, contributions to retirement accounts and investment earnings are not taxed, but withdrawals are) and the future stream of tax payments for an equivalent investment in a taxable account (in which contributions and investment earnings are taxed, but withdrawals are not). Both payment steams are then adjusted for inflation, and the estimate of the tax expenditure is calculated as the difference between them.
The estimates derived using CBO’s present-value method also depend on the agency’s choice of modeling parameters. In the estimates presented in this report, taxpayers make contributions until they reach age 65, at which point they withdraw those contributions in equal installments until they reach age 85. Taxpayers face the same marginal tax rates in retirement as they faced in 2019. Investments are held in interest-bearing securities that are taxed as ordinary income. Those investments earn a rate of return of 3.5 percent, and future taxes are discounted at that same rate.
Many of the modeling parameters that CBO uses are uncertain and could affect the size and distribution of the tax expenditure. One such important parameter is the tax rate on withdrawals from retirement savings accounts. Although the tax rate on contributions can be estimated reliably, the tax rate on withdrawals is more uncertain. Some taxpayers may have lower tax rates on their withdrawals than on their contributions, whereas others may have higher rates on withdrawals. To the extent that the rate on withdrawals is lower than the rate on contributions, the value of the tax expenditure will be smaller under the present-value method. In this analysis, CBO has adopted the convention of applying the same tax rate to both withdrawals and contributions for all taxpayers.
The agency tested that approach and found that in 2019, the marginal income tax rate on contributions was only about 2 percentage points higher than that on withdrawals. Furthermore, CBO estimates that in 2026, after many provisions of the 2017 tax act expire, that difference will shrink, and the marginal tax rate on withdrawals will be higher than that on contributions by 1 percentage point. If CBO instead applied a tax rate on withdrawals that was 1 percentage point lower than that on contributions, the size of the income tax expenditure would be higher than that presented in this report by about $10 billion, or 5 percent, and the distribution of benefits would remain unchanged.
Another important set of parameters includes the rate of return on investments, the discount rate, and the tax rates on investment income. Higher returns on investment generally increase the size of the tax expenditure, as do higher tax rates on those returns. In its analysis, CBO used a rate of return of 3.5 percent, which is equal to the agency’s July 2021 forecast of the interest rate on 10-year Treasury notes at the end of the 10-year budget window. However, many retirement assets are held in investments that offer both higher risk and higher returns than Treasury notes. In the absence of the tax expenditure for pensions and retirement savings accounts, any returns that take the form of dividends and capital gains would typically be taxed at lower rates than is ordinary income. The higher rate of return and lower tax rates tend to offset each other in the estimate of the tax expenditure.
CBO also set the rate of return to equal the discount rate, which reflects the conventional view that people choose investments in such a way that their risk-adjusted rate of return is equal to their discount rate. To test an alternative scenario, CBO also used a rate of return and a discount rate of 6 percent in the analysis. Although the estimate of the income tax expenditure created by the exclusion for pensions and retirement savings accounts would be about 38 percent larger in that alternative scenario, the share of benefits that accrued to each quintile from that tax expenditure would be similar to the share that accrued to them if the discount rate was set at 3.5 percent.
In CBO’s assessment, the cash-flow method is useful for estimating the overall budgetary effect of the tax expenditure, but the present-value method is more appropriate for the distributional analysis in this report for three key reasons. First, the present-value method is better suited to evaluate the benefits over many years within a cross-sectional framework (that is, a framework in which the same households are not observed over time). Second, that method allows for a more consistent treatment of contributions to deductible and non-deductible (Roth plan) accounts. Third, the present-value method does not treat taxable distributions of past contributions as a negative tax expenditure. For example, it does not treat retirees as being better off if the tax expenditure was eliminated.
CBO’s estimate of the income tax expenditure arising from the exclusion for pensions and retirement savings accounts in 2019 is 24 percent higher when measured by the cash-flow method than when measured as the present value of one year’s retirement contributions. The cash-flow method also yields a distribution of benefits for that income tax expenditure that is more skewed toward the top of the distribution than is the estimate obtained using the present-value method. Under the cash-flow method, 73 percent of the benefits of the income tax expenditure would accrue to households in the highest quintile, compared with 63 percent under the present-value method. Similarly, 11 percent of the benefits would accrue to households in the top 1 percent of the distribution, compared with 5 percent under the present-value method.
Incidence of Tax Expenditures
The economic incidence of a change in taxes is the distribution of the change in the economic burdens associated with that tax, after accounting for changes in behavior and prices. Tax expenditures may affect people other than those who directly benefit from them (and they may have different effects on people who ostensibly benefit by the same amounts). But in the present analysis, the incidence of tax expenditures is assigned to the taxpayers who would have been directly liable for the relevant taxes if the provisions that generated the tax expenditure did not exist. Although behavioral responses can affect the incidence of tax expenditures, those responses and the resulting changes in incidence are not reflected in this report. Taxpayers in different income groups may be more or less able to adjust their behavior in response to provisions of law, and taxpayers not directly affected by tax expenditures might be indirectly affected by them.
For example, the estimated tax expenditure arising from the mortgage interest deduction on owner-occupied residences does not reflect any adjustments by taxpayers in the amount of mortgage debt they hold or any effect on housing values. However, high-income taxpayers with other significant assets tend to hold more mortgage debt than they would otherwise because mortgage interest receives preferential tax treatment.10 In addition, the value of that deduction is probably built into housing prices, so even homeowners who do not hold mortgage debt or currently claim the deduction for mortgage interest may benefit from the deduction. However, the estimates in this report attribute the benefit from that tax expenditure to taxpayers entirely on the basis of the mortgage interest deduction they claim.
Another example is the estimate of the tax expenditure created by the exclusion for employment-based health insurance. Removing that exclusion would increase the price of health insurance for many people and could thereby alter their choices about how to obtain health insurance or whether to purchase it at all. Furthermore, by reducing the cost of health insurance for both employers and employees, the exclusion also probably increases prices of health insurance and health care services for people without employment-based health insurance, including those who do not purchase any health insurance. However, neither of those effects is reflected in the estimate of the benefit arising from that exclusion.
There is also uncertainty about the ultimate incidence of the tax expenditure created by the exclusion of capital gains on assets transferred at death. That exclusion could narrowly benefit either decedents or their heirs, or it could have much broader effects on labor income and capital income by affecting saving behavior, much like other taxes on capital income. CBO allocates the tax to decedents; it calculates the value of the tax expenditure by first estimating the tax that each household would owe if a member died and then multiplying that amount by each member’s probability of death.
Finally, in the analysis in this report, CBO allocates the entire value of payroll tax expenditures to employees, which reflects the theoretical incidence of payroll taxes. In other words, if the payroll tax did not exist, an employee’s wages and salaries would, in theory, be higher by approximately the amount of the payroll tax. However, the research literature suggests that many factors could cause the incidence of payroll taxes to differ from CBO’s allocation, especially in the short term.11
Interactions Among Tax Expenditures
When preparing its estimates of tax expenditures in this report, CBO accounted for the interactions among the tax expenditures that would occur if all the tax expenditures were simultaneously eliminated. For example, eliminating a particular income tax exclusion would increase taxable income, pushing some income into tax brackets with higher marginal rates. Eliminating all income tax exclusions would generally increase taxable income by the sum of the individual increases, but a larger share of that additional income would end up in tax brackets with higher marginal rates, thereby increasing government revenues by more than if the income was taxed at lower marginal rates. As a result, the budgetary effect of eliminating all exclusions would be larger than the sum of the effects of eliminating each exclusion separately. Conversely, eliminating all itemized deductions simultaneously would have a smaller effect than eliminating each deduction separately because if all deductions were eliminated, more taxpayers would claim the standard deduction (instead of itemizing deductions) than would be the case if any single deduction was repealed.
However, the combined estimates provided in this report do not include the interaction between the exclusion for pensions and retirement savings accounts and other tax expenditures. The interaction between that tax expenditure and the others is omitted because CBO uses a present-value approach to estimate that exclusion. Because the present-value approach estimates the tax expenditure over a taxpayer’s lifetime rather than in a single year, the interaction of that expenditure with the others cannot be reliably assessed.
Accounting for the interactions among the tax expenditures examined in this report produces a combined estimate that is 4 percent higher than the combined estimate that would result if those interactions were disregarded. However, the interactions among certain subsets of tax expenditures may increase or decrease the estimate by an amount that is greater or less than that percentage.
Effects of Including Payroll Taxes
The exclusions for employment-based health insurance and for pensions and retirement savings accounts not only reduce income subject to the income tax; they also reduce earnings subject to the payroll taxes for Social Security (Old-Age, Survivors, and Disability Insurance, or OASDI) and for Medicare’s Hospital Insurance (HI) Trust Fund. In this report, the estimates of those two exclusions include their effects on payroll taxes.12
Exclusions from payroll taxes also generally reduce future OASDI benefits, which are determined by a person’s lifetime earnings subject to Social Security taxes. The exclusions are unlikely to have much effect on future HI benefits because all workers meeting the eligibility requirements for the HI program are eligible for the same benefits. An ideal measure of the effect of the exclusions on Social Security payroll taxes might subtract the present value of the expected incremental benefits from the amount of the tax in the current year, but CBO’s estimates do not include any effects on future benefits. Including those effects would decrease the budgetary cost of the exclusions.
Researchers who have studied the implicit marginal tax rate on earnings (that is, taxes paid minus the present value of benefits) in the Social Security system have found that the rate varies considerably depending on a worker’s circumstances. Some workers’ implicit marginal tax rate equals the statutory OASDI rate because the workers pay tax but receive no additional benefits from additional earnings. But other workers face a much lower, or even negative, marginal tax rate on their additional earnings. (A negative marginal rate implies that the present value of benefits accruing from additional earnings exceeds the Social Security payroll taxes paid on those earnings.)
Importantly, because the Social Security system replaces a larger share of earnings for low-earning workers than for high-earning ones, high-earning workers face a higher implicit tax rate from Social Security than do low-earning workers. Thus, a full accounting of payroll taxes and Social Security benefits would make the distribution of the exclusions for pensions and retirement savings accounts and for employment-based health insurance appear more progressive than does the current analysis, which examines only the tax effects. However, because other factors besides earnings are important for future Social Security benefits—age, sex, career length, and marital status also affect the implicit tax rate—the effects of the exclusions on future benefits are difficult to estimate.13
1. For its analyses of the distribution of household income, CBO uses a sample of confidential tax data, which is typically available two years after the period to which the data pertain. CBO’s most recent report presenting the analysis of household income was for 2018. For the analysis in the present report, however, the agency used public-use tax data that are statistically altered to protect the confidentiality of individual taxpayers; those data typically become available about six years after the period to which they pertain.
2. For information about how CBO estimates the distribution of taxes and household income, see Congressional Budget Office, The Distribution of Household Income, 2018 (August 2021), www.cbo.gov/publication/57061.
3. In this report, CBO’s estimate of the U.S. population excludes members of the armed forces on active duty and people in institutions such as prisons or nursing homes.
4. The adjustment for household size is only applied to household income for the sake of ranking households to construct income groups. The income amounts reported for each income group are not adjusted for household size.
5. For a list of JCT’s aggregate estimates of tax expenditures in fiscal year 2019, see Joint Committee on Taxation, Estimates of Federal Tax Expenditures for Fiscal Years 2019–2023, JCX-55-19 (December 18, 2019), www.jct.gov/publications/2019/jcx-55-19/.
6. See Joint Committee on Taxation, Estimates of Federal Tax Expenditures for Fiscal Years 2020–2024, JCX-23-20 (November 5, 2020), p. 17, www.jct.gov/publications/2020/jcx-23-20/.
7. For more details about CBO’s framework for distributional analyses and why the agency updated that framework, see Kevin Perese, CBO’s New Framework for Analyzing the Effects of Means-Tested Transfers and Federal Taxes on the Distribution of Income, Working Paper 2017-09 (Congressional Budget Office, December 2017), www.cbo.gov/publication/53345.
8. Most retirement savings plans are subject to the tax treatment outlined here. However, there is a category of plans known as Roth individual retirement arrangements (Roth IRAs) and Roth 401(k)s that are subject to a different treatment. For those plans, contributions are not excluded from taxation, but distributions from those plans are not subject to taxation upon withdrawal.
9. The Treasury also provides present-value estimates for tax expenditures related to deferrals of income, including expenditures for retirement savings and accelerated depreciation of property.
10. For a detailed description of the distributional effects of the mortgage interest deduction, including estimates of the mean mortgage value by income quintile, see Austin J. Drukker, Ted Gayer, and Harvey S. Rosen, “The Mortgage Interest Deduction: Revenue and Distributional Effects,” Journal of Housing Research, vol. 30, no. 1 (May 2021), pp. 1–33, https://tinyurl.com/uy24efj7.
11. See Dorian Carloni, Revisiting the Extent to Which Payroll Taxes Are Passed Through to Employees, Working Paper 2021-06 (Congressional Budget Office, June 2021), www.cbo.gov/publication/57089.
12. In its analysis of tax expenditures, the Treasury provides estimates of the payroll tax expenditure created by the exclusion for employment-based health insurance. Although the Joint Committee on Taxation does not typically provide estimates of payroll tax expenditures, it has previously estimated the effect on payroll taxes of the provision that excludes employers’ contributions for health insurance premiums from workers’ taxable income. See Joint Committee on Taxation, Background Materials for Senate Committee on Finance Roundtable on Health Care Financing, JCX-27-09 (May 8, 2009), www.jct.gov/publications/2009/jcx-27-09/.
13. CBO has estimated the lifetime benefits of Social Security and Medicare, net of payroll taxes paid. See Congressional Budget Office, CBO’s Long-Term Projections for Social Security: Additional Information (September 2019), www.cbo.gov/publication/55590, and Xiaotong Niu, Distribution of Lifetime Medicare Taxes and Spending by Sex and by Lifetime Household Earnings, Working Paper 2017-05 (Congressional Budget Office, August 2017), www.cbo.gov/publication/52985.
About This Document
This report was prepared at the request of the Chairman of the Senate Committee on the Budget. In keeping with the Congressional Budget Office’s mandate to provide objective, impartial analysis, the report makes no recommendations.
Bilal Habib wrote the report with guidance from Edward Harris, John McClelland, and Joseph Rosenberg. Kathleen Burke, Kurt Seibert, and James Williamson contributed to the analysis. Omar Morales fact-checked the report.
Rebecca Heller, Nadia Karamcheva, Sarah Masi, Jennifer Shand, and Carolyn Ugolino (all of CBO) offered comments. Harvey Rosen, Professor Emeritus at Princeton University; Frank Sammartino of the Urban-Brookings Tax Policy Center; and the staff of the Joint Committee on Taxation commented on an earlier draft. The assistance of external reviewers implies no responsibility for the final product; that responsibility rests solely with CBO.
Mark Doms, Jeffrey Kling, and Robert Sunshine reviewed the report. Scott Craver edited it, and Jorge Salazar created the graphics and prepared the text for publication. The report is available at www.cbo.gov/publication/57413.
CBO seeks feedback to make its work as useful as possible. Please send comments to communications@cbo.gov.

Phillip L. Swagel
Director
October 2021