
Notes
Notes
Unless this report indicates otherwise, all years referred to are federal fiscal years, which run from October 1 to September 30 and are designated by the calendar year in which they end. Numbers in the text and tables may not add up to totals because of rounding.
After each fiscal year has ended, the Congressional Budget Office reviews its projections of federal revenues and outlays and the government’s budget deficit and compares them with actual budgetary outcomes for that year.1 By assessing the quality of its projections and identifying the factors that might have led to under- or overestimates of particular categories of federal revenues and outlays, CBO seeks to improve the accuracy of its work.
To review its projections for fiscal year 2021, CBO focused on its March 2020 baseline projections and updated them to include the estimated effects of subsequently enacted legislation. The adjustments were particularly large for 2021 because of legislation enacted in response to the coronavirus pandemic.2 In total, those adjustments—which reflect the estimated budgetary effects reported in cost estimates that CBO and the staff of the Joint Committee on Taxation (JCT) prepared when the legislation was enacted—reduced CBO’s projections of revenue by $0.4 trillion (or 10 percent) and increased its projections of outlays by $2.3 trillion (almost 50 percent).3 CBO also removed outlays for Fannie Mae and Freddie Mac from both its projections and the actual outcomes because CBO and the Administration account for the transactions of those housing entities differently.4
Largely because of the uncertainties associated with the pandemic and the implementation of substantial legislation, some of CBO’s projections for 2021 differed from the actual results by much larger amounts than usual. Taking all adjustments into account, the overall differences were as follows (see Table 1):
- Revenues. CBO’s projection of $3.43 trillion for federal revenues in 2021 was too low—by $614 billion, or 15 percent. That difference was three times the mean absolute error of about 5 percent in revenue projections made for the years from 1983 to 2020.5
- Outlays. CBO’s projection of $7.07 trillion for federal outlays in 2021 was too high—by $250 billion, or 4 percent. That difference of 4 percent was larger than the mean absolute error of 2 percent in outlay projections made for the years from 1993 to 2020.
- Deficit. The differences in revenue and outlay projections resulted in a deficit projection for 2021 that was $864 billion more than the actual amount: $3.64 trillion rather than $2.78 trillion.6 That difference was equal to 3.9 percent of gross domestic product (GDP). By comparison, the mean absolute error in deficit projections reported for 1985 to 2020 equaled 1.0 percent of GDP.
The three categories with the largest misestimates accounted for $789 billion of the deficit difference: individual income taxes, Medicare outlays, and corporate income taxes. By far the largest difference stemmed from an underestimate of receipts from individual income taxes.
Table 1.
CBO’s Budget Projections for 2021, Compared With Actual Outcomes
Billions of Dollars

Data sources: Congressional Budget Office; Department of the Treasury. See www.cbo.gov/publication/57614#data.
The budget projections presented here are based on CBO’s March 2020 baseline; those projections were published in Congressional Budget Office, Baseline Budget Projections as of March 6, 2020 (March 2020), www.cbo.gov/publication/56268. For this analysis, CBO updated those projections to account for the budgetary effects of subsequent legislation as estimated at the time of enactment. The adjustments to the 2021 projections were particularly large by historical standards because of legislation enacted in response to the coronavirus pandemic. For discretionary spending, the amounts reflect estimated outlays stemming from full-year appropriations provided for 2021. Those projections are generally consistent with the technical assumptions (for example, how quickly appropriations will be spent) and economic projections underlying the March 2020 baseline. In addition, the discretionary spending amounts include outlays estimated for 2021 from supplemental appropriations made in 2020 and 2021. Many of those estimates incorporated updated technical and economic assumptions.
* = between zero and $500 million; ** = between -0.5 percent and zero; n.a. = not available.
a. Outlays related to the activities of Fannie Mae and Freddie Mac (which are classified as mandatory) are excluded from this table; CBO projected outlays of $1.1 billion and the 2021 budget recorded $4.9 billion in offsetting receipts (that is, negative outlays) for those activities. Including those outlays, the 2021 budget deficit, as reported by the Department of Treasury, totaled $2,772 billion.
b. The percentage difference is the projected amount minus the actual amount divided by the actual amount.
c. The mean absolute error is the arithmetic average of the projection errors without regard to whether they are positive or negative, so errors in different directions do not offset one another. CBO calculated projection errors by subtracting the actual amount of outlays or revenues from the projection and dividing that difference by the actual outlay or revenue amount. The budget year is the second year of the period covered by CBO’s baseline projections; it usually begins several months after a spring baseline is released. The mean absolute errors for revenues are based on budget-year projections for 1983 to 2020; those for defense and nondefense discretionary spending are based on budget-year projections for 1999 to 2020; and those for all other spending categories are based on budget-year projections for 1993 to 2020. The data necessary to calculate the projection errors in earlier years are not available. For more information, see Congressional Budget Office, An Evaluation of CBO’s Past Revenue Projections (August 2020), www.cbo.gov/publication/56499, and An Evaluation of CBO’s Past Outlay Projections (November 2017), www.cbo.gov/publication/53328.
d. Includes the effects of Medicare premiums and other offsetting receipts.
e. Includes the estimated effects on debt service of enacted legislation.
f. In Congressional Budget Office, An Evaluation of CBO’s Past Deficit and Debt Projections (September 2019), www.cbo.gov/publication/55234, the mean absolute deficit error was expressed as a percentage of gross domestic product (GDP) rather than as a percentage calculated from dollar values in order to account for years in which the actual deficit or surplus was small, causing relatively small projection errors (in dollar terms) to result in large percentage errors. In that analysis, CBO found that the mean absolute error in budget-year deficit projections for 1985 to 2018 was 1.0 percent of GDP. (CBO found that the mean absolute error remained at 1.0 percent after accounting for deficit errors in 2019 and 2020.) By comparison, the deficit error in 2021 equaled 3.9 percent of GDP.
How CBO Conducted This Analysis
CBO regularly publishes baseline projections of federal revenues, outlays, and deficits for the current fiscal year and the ensuing decade. Those projections reflect the assumption that current laws governing taxes and spending will generally remain unchanged. This analysis focuses on the projections for 2021 in CBO’s March 2020 baseline (adjusted for subsequent legislation).
In most years, CBO uses the technical assessments (such as how quickly appropriations would be spent) and economic projections underlying its spring baseline from the prior year (in this case, 2020) to produce cost estimates for legislation affecting the budget year (in this case, 2021) and beyond.7 (The budget year is the second year of the period covered by CBO’s baseline projections; it usually begins several months after a spring baseline is released.) This year, however, the rapidly evolving effects of the pandemic on the economy led CBO to use updated projections of certain factors (such as the unemployment rate) when producing cost estimates for some of that legislation.
Any comparison of CBO’s projections with actual outcomes is complicated by legislation that was enacted after the projections were completed. CBO does not attempt to predict future legislative changes or their effects on revenues and outlays when it prepares its baseline budget projections, but actual revenues and outlays invariably differ from CBO’s estimates as a result of such changes.
To account for those changes, CBO updated its projections to incorporate the estimated effects of subsequent legislation. Those amounts reflect the estimated budgetary effects reported in the cost estimates that CBO and the staff of JCT prepared when the legislation was enacted as well as the estimated increase in spending for interest on the federal debt that resulted from enacted legislation. (The interest effects were not included in the cost estimates.)
Adjusting projections to reflect the cost estimates provided to the Congress allows CBO to evaluate the quality of information provided to lawmakers for scorekeeping purposes. The Congress generally incorporates those same adjustments when updating the baseline it uses for enforcement of budgetary rules throughout the year as legislation is enacted. As a result, this report examines not only the accuracy of the initial baseline projections, but also the accuracy of information about the 2021 budget that CBO provided to the Congress from March 2020 through the end of fiscal year 2021.
Thus, any errors in the initial cost estimates are included in the differences discussed in this report. In particular, the ongoing public health emergency has continued to affect many of the factors underlying CBO’s original cost estimates for legislation enacted in response to the pandemic, causing the errors in estimates for a number of programs to be larger in 2021 than their historical averages.
How CBO’s Projections for 2021 Compare With Actual Outcomes
In its updated March 2020 baseline projections, which include the estimated budgetary effects reported in its cost estimates for subsequent legislation, CBO overestimated the federal deficit in 2021—the result of underestimating revenues and overestimating outlays.
Revenues
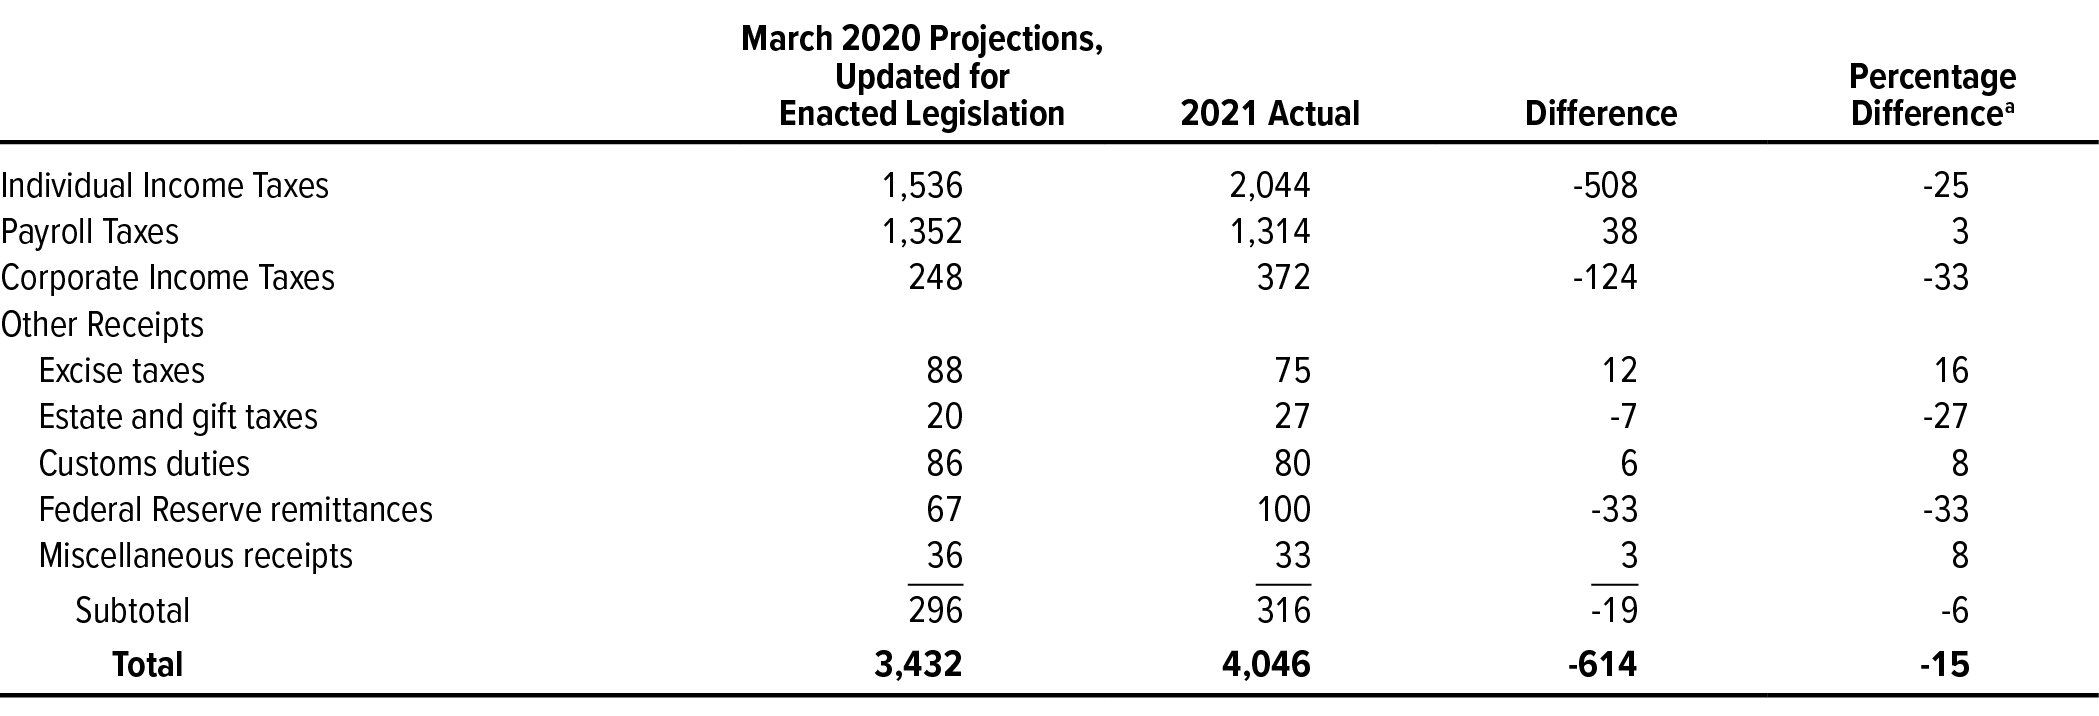
CBO’s projection of revenues in 2021 was $3,432 billion, $614 billion (or 15 percent) less than the actual amount (see Table 2). That difference stems from underestimates of individual and corporate income tax receipts and remittances from the Federal Reserve. CBO overestimated payroll taxes, excise taxes, and customs duties, but by much smaller amounts.
Table 2.
CBO’s Projections of Revenues for 2021, Compared With Actual Revenues
Billions of Dollars
Data sources: Congressional Budget Office; Department of the Treasury. See www.cbo.gov/publication/57614#data.
The budget projections presented here are based on CBO’s March 2020 baseline; those projections were published in Congressional Budget Office, Baseline Budget Projections as of March 6, 2020 (March 2020), www.cbo.gov/publication/56268. For this analysis, CBO further updated those projections to account for the budgetary effects of subsequent legislation as estimated at the time of enactment.
a. The percentage difference is the projected amount minus the actual amount divided by the actual amount.
Tax revenues are sensitive to economic conditions. Typically, projections of tax revenues made before an economic downturn overstate actual revenues because they do not account for the unanticipated declines in taxable income that accompany recessions. However, following the economic disruption in the spring of 2020, CBO’s revenue projections underestimated actual revenues. That may reflect the unusual nature of this recession, which affected certain sectors of the economy and groups of taxpayers more than others, as well as the impact of legislation enacted in response to the pandemic. The factors influencing the underestimates of revenues in 2021 will be better understood as more detailed tax data become available over the next two years. Significant sources of error probably include differences in actual economic activity in 2021 from CBO’s projections and differences in the budgetary effects of enacted legislation from estimates produced at the time of enactment.
Individual Income Taxes. CBO’s projection of receipts from individual income taxes in 2021 was $1,536 billion, $508 billion (or 25 percent) less than the actual amount of $2,044 billion. The reasons for that discrepancy will not be known until more detailed tax records covering 2021 payments become available. The underestimate of receipts may be attributable, in part, to misestimates of the magnitude or timing of effects of legislation enacted in response to the pandemic.
On the basis of estimates made around the time of enactment (that is, estimates used for budget enforcement purposes), CBO and JCT expected the various pieces of legislation enacted between March 2020 and September 2021 to reduce individual income tax receipts in 2021 by a total of $368 billion (see Table 1). Those estimated effects stemmed from provisions of several laws including the following:
- The Families First Coronavirus Response Act, enacted in 2020, created tax credits for employers that were required by that law to provide emergency paid sick leave and emergency paid family and medical leave.
- The Coronavirus Aid, Relief, and Economic Security Act (CARES Act), also enacted in 2020, provided for deferral of payments of some payroll taxes, created tax credits for employee retention, and relaxed the limitation on the amount of business losses that could be used to offset tax liability.
- The Consolidated Appropriations Act, 2021 (CAA) and the American Rescue Plan Act of 2021 (ARPA) extended the availability of some of those credits and contained other provisions affecting individual income tax revenues. Although some of those laws’ provisions affect payroll taxes, the Treasury recorded such effects in the budget as individual income tax reductions.
Subsequent information from administrative records of the Internal Revenue Service (IRS) and other sources indicate that usage of some provisions was lower than anticipated. In particular, a smaller share of businesses opted to defer the employer share of payroll taxes than was originally anticipated. Because fewer employers chose to defer payment of payroll taxes, collections in 2021 were larger than anticipated. (Payroll taxes deferred in 2020 and 2021 are required to be repaid in 2022 and 2023.) In addition, according to IRS processing records through July 15, 2021, the use of tax credits for paid leave and employee retention was also less than initially anticipated.8 However, the extent to which the recorded lower usage reflects delays in IRS processing remains uncertain.
Payroll Taxes. CBO’s projection of payroll tax receipts for 2021 was $1,352 billion, $38 billion (or 3 percent) more than the actual amount of $1,314 billion. That overestimate is largely attributable to the way that the Treasury records payroll taxes, and it reflects adjustments made by the Treasury for past activity that were larger than CBO anticipated. When the Treasury receives payments of withheld taxes, it cannot distinguish payroll taxes from individual income taxes. Instead, it first allocates withheld taxes to one source or the other on the basis of estimates made in advance of actual collections. As additional information becomes available, including detailed tax return information, the Treasury makes periodic reallocations to revise past allocations. The amounts recorded by the Treasury as payroll taxes for 2020 were largely determined before the onset of the pandemic, and the effects of subsequent declines in wages and enacted legislation were recorded as lower individual income tax receipts in 2020. In 2021, the Treasury reclassified $38 billion of past payroll taxes as individual income taxes, which reduced reported payroll taxes and increased reported income taxes for the year.
Corporate Income Taxes. CBO’s projection of receipts for corporate income taxes in 2021 was $248 billion, $124 billion (or 33 percent) less than the actual amount of $372 billion.
The unexpected strength in corporate income tax receipts in 2021 can be partly explained by the strength of domestic corporate profits. Estimates made by the Bureau of Economic Affairs (BEA) of domestic corporate profits for the first half of calendar year 2021 were 24 percent higher than CBO projected in March 2020. Additionally, BEA data indicate that a larger share of domestic corporate profits in calendar year 2020 was earned in the second half of the year, which may have affected the pattern of corporate income tax payments for liabilities accrued in 2020.
Other Sources. CBO’s projection of receipts from all other sources in 2021 was $296 billion, $19 billion (or about 6 percent) less than the actual amount of $316 billion in 2021. That underestimate reflects larger remittances from the Federal Reserve and higher-than-anticipated estate and gift taxes. Those underestimates were partially offset by overestimates of excise taxes, customs duties, and miscellaneous receipts.
Specifically, remittances from the Federal Reserve in CBO’s projection for 2021 were $33 billion (or 33 percent) below actual values for 2021. That underestimate is largely attributable to the effects of the actions taken by the central bank to address the economic disruption stemming from the pandemic. In particular, in 2020 the Federal Reserve significantly increased its asset holdings, which generated additional interest income, and lowered short-term interest rates, reducing its interest expense. Those actions increased remittances in 2021.
Projected estate and gift tax revenues were $7 billion (or 27 percent) lower than actual revenues for 2021 because of the unanticipated increase in the number of deaths and an increase in taxable gifts occurring in 2020. People typically increase the amount of gifts made when they expect higher estate tax rates in the future.
Excise taxes for 2021 were overestimated by $12 billion (or 16 percent). The largest contributor to that overestimate was smaller collections of aviation taxes dedicated to the Airport and Airway Trust Fund. Those collections fell because air travel declined after the onset of the pandemic.
Customs duties were overestimated by $6 billion (or 8 percent), in large part because the actual volumes of various types of taxable imports differed from CBO’s expectations. CBO also overestimated other miscellaneous receipts by about $3 billion (or 8 percent).
Outlays
In its baseline projections, CBO divides federal outlays into three broad categories—mandatory, discretionary, and net interest.9 Including the estimated effects of legislation, CBO’s projection of outlays in 2021 was $7,073 billion, $250 billion (or 4 percent) more than the actual amount. CBO overestimated outlays for all three categories.10
Mandatory Outlays. CBO’s projection of mandatory outlays in 2021 was $4,946 billion, $115 billion (or 2 percent) more than the actual amount of $4,832 billion (see Table 3). Large overestimates of spending for some programs, particularly Medicare, were partially offset by large underestimates for other programs, particularly higher education and income security programs. Many programs affected by legislation enacted in response to the pandemic had large differences between CBO’s projections and actual outlays. (Accounting adjustments related to certain loans and loan guarantees made in previous years—credit subsidy reestimates—also produced large differences, but the positive and negative credit reestimates were generally offsetting.)
Table 3.
CBO’s Projections of Mandatory Outlays for 2021, Compared With Actual Outlays
Billions of Dollars

Data sources: Congressional Budget Office; Department of the Treasury. See www.cbo.gov/publication/57614#data.
The budget projections presented here are based on CBO’s March 2020 baseline; those projections were published in Congressional Budget Office, Baseline Budget Projections as of March 6, 2020 (March 2020), www.cbo.gov/publication/56268. For this analysis, CBO further updated those projections to account for the budgetary effects of subsequent legislation as estimated at the time of enactment.
* = between -$500 million and zero; ** = between zero and 0.5 percent; † = the projected value was about 10 times the actual value; †† = the projected value was about 13 times the actual value; n.a. = not applicable.
a. Outlays related to the activities of Fannie Mae and Freddie Mac (which are classified as mandatory) are excluded from this table.
b. The percentage difference is the projected amount minus the actual amount divided by the actual amount.
c. Includes the effects of Medicare premiums and other offsetting receipts.
d. Excludes the effects of updated estimates by federal agencies of the subsidy costs of certain federal loans and loan guarantees made in previous years. Those effects are reflected in the “Credit Subsidy Reestimates” line.
Major Health Care Programs. CBO’s projection of outlays for the major health care programs (which consist of outlays for Medicare, Medicaid, and the Children’s Health Insurance Program, as well as for subsidies for health insurance purchased through the marketplaces established under the Affordable Care Act and related spending) exceeded actual amounts by $81 billion (or 6 percent). That difference resulted from a large overestimate of Medicare outlays that was partially offset by underestimates of outlays for the other three programs.
CBO overestimated Medicare outlays by $157 billion (or 23 percent) in 2021. Most of that difference stems from two changes related to the pandemic. First, in the spring of 2021, Medicare began partial recoupment of $107 billion in payments to providers made in 2020 in advance of expected health care claims. Second, payments for beneficiaries in fee-for-service Medicare were less than projected because beneficiaries avoided surgeries and other medical services as a result of the pandemic.
CBO’s projection of outlays for the other three programs was $76 billion below actual amounts in 2021, primarily because of a $58 billion (or 11 percent) underestimate of Medicaid outlays. Most of the difference stems from the estimated effects of legislation enacted in response to the pandemic. The federal matching rate for Medicaid was increased for the duration of the pandemic (retroactive to January 2020) and, in order to receive that higher rate, states were required to provide continuous coverage for all Medicaid recipients for the same period. That requirement increased both enrollment and outlays by significantly more than CBO had originally anticipated. CBO also underestimated subsidies for health insurance purchased through the marketplaces established by the Affordable Care Act and related spending by $16 billion (or 23 percent), primarily because enrollment was higher than the agency had anticipated.
Higher Education. CBO’s projection of spending for higher education in 2021 (excluding credit subsidy reestimates) was $79 billion below the actual amount. That difference was mostly the result of modifications made by the Department of Education to the terms of outstanding student loans. Those modifications were made in response to the coronavirus pandemic and to implement an automatic discharge of loans for individuals identified by the Department of Veterans Affairs as totally and permanently disabled.
Income Security. CBO’s projection of outlays in 2021 for income security programs—which make payments to certain people and government entities to assist the poor, the unemployed, and others in need—was lower, on net, than the actual amount by $74 billion (or 5 percent). The largest differences were in CBO’s projection of outlays associated with refundable tax credits, primarily the child tax credit, and the Supplemental Nutrition Assistance Program (SNAP). The child tax credit accounted for $31 billion of the $46 billion total underestimate for refundable tax credits, in part because payments that were initially anticipated to be made in 2022 were made in 2021. That credit was temporarily expanded for calendar year 2021. Previously, that credit was paid when tax returns were filed, but in 2021, a portion of the credit was paid in advance monthly payments.
In addition, outlays for SNAP in 2021 exceeded CBO’s projection by $34 billion, primarily because the agency underestimated participation in the program, which increased as a result of the pandemic. Additionally, CBO underestimated the growth in food costs that affected benefit levels for 2021.
Coronavirus State and Local Fiscal Recovery Funds. CBO’s projection of outlays in 2021 for direct assistance to state, local, tribal, and territorial governments in response to the pandemic was higher than the actual amount by $40 billion (or 17 percent). The process to apply for such assistance took more time to complete than CBO anticipated, particularly for tribal governments.
Social Security. The agency overestimated Social Security outlays by $24 billion (or 2 percent) in 2021. That overestimate was the result of a smaller-than-anticipated increase in the number of beneficiaries and a smaller- than-anticipated cost-of-living adjustment in December 2020.
Small Business Administration. CBO’s projection of mandatory outlays in 2021 for the Small Business Administration (excluding credit subsidy reestimates) was higher than the actual amount by $24 billion (or 7 percent). CBO overestimated spending for Emergency Economic Injury Disaster Loan advance payments provided to businesses affected by the pandemic by $29 billion, mostly because demand for those loans was less than expected. Underestimates of spending for other programs partially offset that amount.
Credit Subsidy Reestimates. Updated estimates by federal agencies of the subsidy costs of certain federal loans and loan guarantees made in previous years boosted actual outlays, on net, by $3 billion in 2020.11 That increase was the result of a $56 billion increase in the estimated costs of past student loans made by the Department of Education, partially offset by a decrease in estimated costs for other programs, the largest being a $24 billion reduction in the estimated costs of past loans made by the Small Business Administration. In addition, the costs of loans and loan guarantees made by the Treasury Department’s Economic Stabilization Program and of mortgage guarantees made by the Department of Housing and Urban Development in previous years were each reduced by $13 billion.12 Those updated estimates were not available when CBO completed its March 2020 baseline projections, and CBO had no basis for determining what revisions, if any, would be made in 2021 or in future years. Therefore, the agency did not include any such revisions in its March 2020 projections.
Other Mandatory Programs. The largest remaining differences between CBO’s projections and actual outlays were overestimates for programs related to the ongoing pandemic. Those programs were the following:
- Projected outlays for veterans’ programs exceeded actual amounts by $15 billion (or 12 percent).
- Projected outlays for the Exchange Stabilization Fund exceeded actual outlays (which were negative) by $11 billion (nearly 100 percent).
- Projected outlays for the Public Health and Social Service Emergency Fund were three times actual outlays, exceeding them by $10 billion.
- Projected outlays for the Homeowner Assistance Fund and transit infrastructure grants were each more than ten times the actual amount, in each case exceeding it by $9 billion.
For some other programs, CBO’s estimates were very close to actual amounts. For example, CBO overestimated outlays for federal civilian and military retirement by $1 billion (or 0.4 percent). The agency’s projection for all other mandatory spending exceeded actual amounts by $46 billion (or 77 percent).
Discretionary Outlays. To evaluate its projections of discretionary outlays, CBO updated the funding amounts projected in its March 2020 baseline to reflect the regular full-year appropriations provided for 2021 in appropriation bills, which were enacted in the first few months of the fiscal year. CBO generally applied the technical assessments (such as how quickly appropriations would be spent) and economic projections underlying its March 2020 baseline to those updated amounts of funding. For supplemental appropriations (which were primarily provided in response to the pandemic), CBO used technical assessments and economic projections that reflected the agency’s views around the time of enactment. After those adjustments were made, CBO’s projection of discretionary outlays in 2021 was $1,722 billion, $83 billion (or 5 percent) more than the actual amount of $1,639 billion. CBO underestimated defense outlays by $7 billion (or 1 percent) and overestimated nondefense outlays by $89 billion (or 10 percent).
CBO’s projections of discretionary outlays for many agencies were close to actual amounts in 2021 in nominal terms (see Table 4). However, projections for a few agencies resulted in significantly larger errors. Nearly all of those differences were related to assessments of how quickly supplemental funding provided in response to the pandemic would be spent. The largest overestimates were the following:
- The projection of spending by the Department of Health and Human Services was $79 billion (or 44 percent) more than the actual amount. The largest part of that difference was a $68 billion overestimate of outlays for the Public Health and Social Service Emergency Fund. That fund received large appropriations in both 2020 and 2021 in response to the pandemic for testing, contact tracing, the purchase and manufacturing of vaccines and therapeutics, and payments to health care providers. CBO had anticipated that spending from this fund in 2021 would continue at a rate similar to that in 2020; instead, spending, particularly payments to health care providers, slowed significantly.
- The projection of spending by the Department of Transportation was $18 billion (or 18 percent) more than the actual amount. Spending on transit infrastructure grants and highway infrastructure programs was slower than anticipated and accounts for most of that difference.
- The projection of spending by the Department of Agriculture was $8 billion (or 24 percent) more than the actual amount. About half of that difference was the result of funding provided to the Commodity Credit Corporation in 2020 in response to the pandemic that CBO estimated would be spent in 2021. That funding was instead spent in 2020. Slower-than-anticipated spending by the Office of the Secretary of funding provided in 2021 accounts for most of the remaining difference.
Table 4.
CBO’s Projections of Discretionary Outlays for 2021, Compared With Actual Outlays
Billions of Dollars

Data sources: Congressional Budget Office; Department of the Treasury. See www.cbo.gov/publication/57614#data.
The budget projections presented here are based on CBO’s March 2020 baseline; those projections were published in Congressional Budget Office, Baseline Budget Projections as of March 6, 2020 (March 2020), www.cbo.gov/publication/56268. For this analysis, CBO further updated those projections to account for the budgetary effects of subsequent legislation as estimated at the time of enactment. The amounts reflect estimated outlays stemming from full-year appropriations provided for 2021. Those projections are generally consistent with technical assumptions (for example, how quickly appropriations will be spent) and economic projections underlying the March 2020 baseline. In addition, the discretionary spending amounts include outlays estimated for 2021 from supplemental appropriations made in 2020 and 2021. Many of those estimates incorporated updated technical and economic assumptions.
* = between -$500 million and $500 million.
a. The percentage difference is the projected amount minus the actual amount divided by the actual amount.
In the other direction, CBO’s projections were below actual amounts for some agencies. The largest such differences were the following:
- The projection of spending by the Department of Defense was less than the actual amount by $9 billion (or 1 percent). Faster-than-anticipated spending on research and development and personnel accounts for most of that difference.
- The projection of spending by the Small Business Administration was less than the actual amount by $8 billion (or 83 percent). Most of that difference was the result of an unanticipated sharp increase in disaster loans provided in the second half of the fiscal year to businesses affected by the pandemic.
Net Interest. Net outlays for interest consist of the government’s interest payments on debt held by the public minus interest income that the government receives. CBO’s projection of those outlays in 2021 was $405 billion, $52 billion (or 15 percent) more than the actual amount of $352 billion (see Table 1).
Most of the difference is attributable to economic factors. In particular, CBO overestimated interest rates for 2021. For example, in the economic forecast underlying the agency’s March 2020 baseline, CBO projected that the interest rate on 3-month Treasury bills would average 1.6 percent in both 2020 and 2021. Instead, that rate fell sharply, averaging 0.7 percent in 2020 and 0.1 percent in 2021.
How the Accuracy of CBO’s Projections for 2021 Compares With the Accuracy of Its Past Budget Projections
The errors in CBO’s projections of revenues and outlays in 2021 were larger than the mean absolute errors in the agency’s projections for previous years, mostly because of the uncertainties associated with the pandemic and the implementation of significant legislation enacted in response. Because those errors both contributed to an overestimate of the deficit, the deficit error was also larger.13
Deficit
In projections that CBO made for 1985 to 2020, the agency overestimated the deficit in the budget year roughly two-thirds of the time, and the mean absolute error in the deficit projections equaled 1.0 percent of GDP. In its updated March 2020 baseline projections, which include the estimated budgetary effects of subsequent legislation (and exclude spending for Fannie Mae and Freddie Mac), CBO overestimated the deficit in the budget year (that is, 2021) by $864 billion, or by 3.9 percent of GDP.
Revenues
For the period between 1983 and 2020, CBO overestimated total revenues in the budget year about as often as it underestimated them, and the mean absolute error in the revenue projections was 5 percent. However, for periods close to business cycle peaks during that same period, the mean absolute error of revenue projections was 16 percent. In its March 2020 baseline combined with the estimated effects of subsequent legislation, the agency’s estimate for 2021 fell short of the actual amount by 15 percent (see Figure 1).
Figure 1.
Projection Errors for Revenues

Data source: Congressional Budget Office. See www.cbo.gov/publication/57614#data.
The 2021 projection shown here is based on CBO’s March 2020 baseline budget projections; those projections were published in Congressional Budget Office, Baseline Budget Projections as of March 6, 2020 (March 2020), www.cbo.gov/publication/56268. For this analysis, CBO further updated those projections to account for the budgetary effects of subsequent legislation as estimated at the time of enactment.
The mean absolute error is the arithmetic average of the projection errors without regard to whether they are positive or negative, so errors in different directions do not offset one another. CBO calculated projection errors by subtracting the actual revenue amount from the projection and dividing that difference by the actual revenue amount.
The mean absolute errors are based on budget-year projections for 1983 to 2020. The budget year is the second year of the baseline projections; it usually begins several months after a spring baseline is released.
CBO underestimated individual income tax revenues in 2021 by 25 percent, more than triple the mean absolute error of 7 percent over the 1983–2020 period. CBO’s projection of payroll tax revenues in 2021 was 3 percent above the actual amount, compared with the mean absolute error of 2 percent recorded over the period from 1983 to 2020.
Corporate income taxes, which are often the major source of revenues subject to the greatest uncertainty, had the largest mean absolute error over the 1983–2020 period—17 percent. For 2021, CBO underestimated those revenues by 33 percent. The agency’s estimate of revenues from all other sources, on net, was 6 percent less than the actual amounts—similar to the mean absolute error of 6 percent recorded over the 1983–2020 period.
Outlays
Between 1993 and 2020, CBO overestimated total outlays in the budget year more often than it underestimated them, and the mean absolute error in the outlay projections was 2 percent. In its updated March 2020 baseline projections, which include the estimated budgetary effects of subsequent legislation, the agency overestimated total outlays in the budget year by 4 percent (see Figure 2).
Figure 2.
Projection Errors for Outlays

Data source: Congressional Budget Office. See www.cbo.gov/publication/57614#data.
The mean absolute error is the arithmetic average of the projection errors without regard to whether they are positive or negative, so errors in different directions do not offset one another. CBO calculated projection errors by subtracting the actual outlay amount from the projection and dividing that difference by the actual outlay amount.
The 2021 projection shown here is based on CBO’s May 2019 baseline budget projections; those projections were published in Congressional Budget Office, Baseline Budget Projections as of March 6, 2020 (March 2020), www.cbo.gov/publication/56268. For this analysis, CBO further updated those projections to account for the budgetary effects of subsequent legislation as estimated at the time of enactment.
The mean absolute errors are based on budget-year projections for 1983 to 2020. The budget year is the second year of the period covered by CBO’s baseline projections; it usually begins several months after a spring baseline is released. The actual outcomes were adjusted to exclude outlays related to the activities of Fannie Mae and Freddie Mac (which are classified as mandatory).
CBO overestimated mandatory outlays in 2021 by 2 percent. Between 1993 and 2020, the mean absolute error in projections of mandatory spending was larger—3 percent. The errors for both Medicare and Medicaid in 2021 significantly exceeded the mean absolute errors in projections for those programs over the 1993–2020 period. The 2021 Social Security projection error was smaller than those for Medicare and Medicaid, but still exceeded its mean absolute error between 1993 and 2020. The error for 2021 for all other mandatory outlays was much smaller than the historical error for such outlays.
CBO overestimated discretionary spending in 2021 by 5 percent, which is greater than the mean absolute error of 2 percent recorded between 1993 and 2020.
CBO has often overestimated net outlays for interest, and the agency did so again in its projections for 2021, by 15 percent. By comparison, the mean absolute error in CBO’s projections of net outlays for interest between 1993 and 2020 was 9 percent.
How CBO’s More Recent Projections Compare With Actual Outcomes in 2021
CBO’s most recent projections for fiscal year 2021 were published in February 2021 and July 2021.14 To compare those projections with actual outcomes, CBO updated them to account for the enactment of subsequent legislation and excluded spending for Fannie Mae and Freddie Mac.
In the February 2021 projections as updated, CBO underestimated revenues by $620 billion, an error similar to that in its updated March 2020 projections. The agency’s outlay projection was closer than its March 2020 projection, exceeding actual amounts by $52 billion (compared with $250 billion in March 2020). As a result, the deficit projection was too high by $672 billion, or 3.0 percent of GDP, compared with an overestimate of 3.9 percent of GDP in CBO’s updated March 2020 projections.
CBO’s estimate of the deficit that was published in July 2021 (and prepared in June of that year) was $231 billion (or 1.0 percent of GDP) more than the actual amount. That error was $441 billion smaller than the deficit error in its February 2021 projection; revenues accounted for $416 billion of that improvement. In total, revenue projections were $204 billion (5.0 percent) less than the actual amount, and projections of outlays were $27 billion (0.4 percent) more.
1. For last year’s edition of this report, see Congressional Budget Office, The Accuracy of CBO’s Budget Projections for Fiscal Year 2020 (December 2020), www.cbo.gov/publication/56885.
2. Those laws include the Families First Coronavirus Response Act, the Coronavirus Aid, Relief, and Economic Security Act, the Paycheck Protection Program and Health Care Enhancement Act, and the American Rescue Plan Act of 2021. (The budgetary effects of the Coronavirus Preparedness and Response Supplemental Appropriations Act were included in CBO’s March 2020 baseline projections.)
3. In its September 2020 and July 2021 baselines, CBO revised its estimates of the effects of recently enacted legislation on certain programs by decreasing outlays in 2021 by $54 billion, on net. For more information on those revisions, see Congressional Budget Office, An Update to the Budget Outlook: 2020 to 2030 (September 2020), www.cbo.gov/publication/56517, and Additional Information About the Updated Budget and Economic Outlook: 2021 to 2031 (July 2021), www.cbo.gov/publication/57263. The estimated effects on outlays for 2021 may be further revised when CBO updates its evaluation of outlay projections. For an earlier report, see Congressional Budget Office, An Evaluation of CBO’s Past Outlay Projections (November 2017), www.cbo.gov/publication/53328.
4. For more information about the differences, see Congressional Budget Office, Accounting for Fannie Mae and Freddie Mac in the Federal Budget (September 2018), www.cbo.gov/publication/54475.
5. The mean absolute error is the arithmetic average of the projection errors without regard to whether they are positive or negative, so errors in different directions do not offset one another. CBO calculated projection errors by subtracting the actual amount of outlays or revenues from the projection and dividing that difference by the actual outlay or revenue amount. The mean absolute error in the deficit projections was expressed as a percentage of gross domestic product rather than as a percentage calculated from dollar values in order to account for years in which the actual deficit or surplus was small, causing relatively small projection errors (in dollar terms) to result in large percentage errors.
6. Removing outlays for Fannie Mae and Freddie Mac reduced projected outlays by $1.1 billion and increased actual outlays by $4.9 billion. Without that adjustment, the 2021 deficit, as reported by the Treasury, totaled $2.77 trillion.
7. For a more detailed discussion of CBO’s March 2020 projections, see Congressional Budget Office, Baseline Budget Projections as of March 6, 2020 (May 2020), www.cbo.gov/publication/56268. For more detailed discussions of the quality of CBO’s projections, see Congressional Budget Office, An Evaluation of CBO’s Past Revenue Projections (August 2020), www.cbo.gov/publication/56499, An Evaluation of CBO’s Past Deficit and Debt Projections (September 2019), www.cbo.gov/publication/55234, and An Evaluation of CBO’s Past Outlay Projections (November 2017), www.cbo.gov/publication/53328.
8. See Congressional Budget Office, The Budgetary Effects of the Tax Credit for Employer-Paid Sick and Family Leave During the Coronavirus Pandemic (July 2021), www.cbo.gov/publication/57362, and The Budgetary Effects of the Employee Retention Tax Credit During the Coronavirus Pandemic (July 2021), www.cbo.gov/publication/57365.
9. Mandatory spending consists of outlays for some federal benefit programs, such as Social Security, Medicare, and Medicaid, and certain other payments to people, businesses, nonprofit institutions, and state and local governments. It is governed by statutory criteria and is not normally controlled by the annual appropriation process. Discretionary spending is controlled by appropriation acts that specify the amounts that are to be provided for a broad array of government activities, including, for example, defense, law enforcement, and transportation. Net outlays for interest consist of the government’s interest payments on debt held by the public minus interest income that the government receives.
10. Because the Treasury does not report discretionary and mandatory totals for accounts that include both types of outlays, CBO has estimated how the Office of Management and Budget will ultimately categorize outlays for those accounts for 2021.
11. Under the Federal Credit Reform Act of 1990, a program’s subsidy costs are calculated by subtracting the present value of the government’s projected receipts from the present value of its projected payments. The estimated subsidy costs can be increased or decreased in subsequent years to reflect updated assessments of the payments and receipts associated with the program. A present value is a single number that expresses a flow of current and future income (or payments) in terms of an equivalent lump sum received (or paid) at a specific time. The present value depends on the rate of interest (the discount rate) that is used to translate future cash flows into current dollars.
12. The Economic Stabilization Program provided loans, loan guarantees, or investments to assist airlines and other eligible businesses, states, and municipalities affected by the pandemic.
13. For more detailed discussions about the quality of CBO’s projections, see Congressional Budget Office, An Evaluation of CBO’s Past Revenue Projections (August 2020), www.cbo.gov/publication/56499, An Evaluation of CBO’s Past Deficit and Debt Projections (September 2019), www.cbo.gov/publication/55234, and An Evaluation of CBO’s Past Outlay Projections (November 2017), www.cbo.gov/publication/53328.
14. See Congressional Budget Office, Additional Information About the Updated Budget and Economic Outlook: 2021 to 2031 (July 2021), www.cbo.gov/publication/57263, and The Budget and Economic Outlook: 2021 to 2031 (February 2021), www.cbo.gov/publication/56970.
At the request of the House and Senate Committees on the Budget, the Congressional Budget Office periodically reports on the accuracy of its baseline spending and revenue projections by comparing them with actual outcomes. Such evaluations help guide CBO’s efforts to improve the quality of its projections, and they are offered as background information to assist Members of Congress in their use of the agency’s estimates. Earlier editions of this report are available at www.cbo.gov/topics/budget/accuracy-projections. In keeping with CBO’s mandate to provide objective, impartial analysis, the report makes no recommendations.
Barry Blom and Jennifer Shand prepared the report, with contributions from many members of CBO’s Budget Analysis and Tax Analysis Divisions and with guidance from Christina Hawley Anthony, Theresa Gullo, John McClelland, and Joshua Shakin.
Robert Sunshine reviewed the report. Caitlin Verboon edited it, and R. L. Rebach created the graphics and prepared the text for publication. The report is available on CBO’s website at www.cbo.gov/publication/57614.
CBO seeks feedback to make its work as useful as possible. Please send comments to communications@cbo.gov.

Phillip L. Swagel
Director