As policymakers consider the composition of policy changes to be used to reduce future budget deficits, many factors may play a role. The most fundamental question is what role the government should play in the U.S. economy and society. The amount and composition of federal spending and revenues affect the total amount and types of output that are produced and consumed in the country, the distribution of those material resources among various segments of society, and people’s well-being in a variety of ways.
Many observers have wondered whether it is possible to return to policies regarding federal spending and revenues that, in earlier years, usually generated deficits that were small relative to GDP and kept the amount of debt held by the public to between about one-quarter and one-half of GDP. Looking for historical reference points is natural. However, the aging of the population and rising costs for health care have changed the backdrop for federal budget policy in a fundamental way. To see this point most clearly, it is useful to consider the historical experience and CBO’s projections for three broad categories of the budget: revenues; spending for Social Security, Medicare, and other major health care programs; and all other spending excluding interest payments. I’ll discuss federal revenues in today’s blog posting and will address the other areas of the budget over the course of the rest of the week.
Federal revenues have averaged 18.0 percent of GDP during the past 40 years. They have varied substantially around that level but show no clear trend. Under current law, revenues equal 15.3 percent of GDP in 2011 and will rise to about 21 percent of GDP in 2021; if, instead, all of the tax provisions that are scheduled to expire under current law were extended, revenues in 2021 would be close to their historical average of 18 percent.
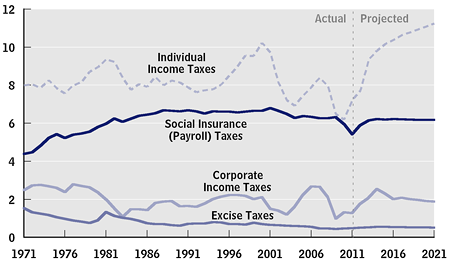
Individual income tax receipts account for most of the projected increase in federal revenues over the coming decade, largely because of scheduled changes in tax law and features of the tax system that cause revenues to rise faster than income over time, as well as projected increases in receipts that reflect an expected rebound in taxable income and some other effects of the economic recovery. As a result, individual income tax receipts increase steadily in CBO’s baseline, from 7.2 percent of GDP in 2011 to 11.2 percent in 2021 (see the figure below). By comparison, such receipts stood at 8.0 percent in 1971. Receipts from both social insurance and corporate income taxes are projected to increase modestly relative to GDP over the next 10 years, remaining in the vicinity of their 40-year averages, CBO projects.
| Revenues by Source (Percent of GDP) |
 |
Two additional perspectives on the evolution of the federal tax system during the past several decades are provided by changes in the burden of taxes on households at different points in the distribution of income and by changes in tax rates that affect the after-tax return to additional work or saving. Households generally bear the economic cost, or burden, of the taxes that they pay directly, such as individual income taxes (including taxes paid on dividends, interest, and capital gains) and employees’ share of payroll taxes. Households also bear the burden of the taxes paid by businesses; in particular, in CBO’s judgment (and that of most economists), employers’ share of payroll taxes is passed on to employees in the form of lower wages. One measure of the tax burden is the average tax rate—that is, the taxes paid as a share of income.
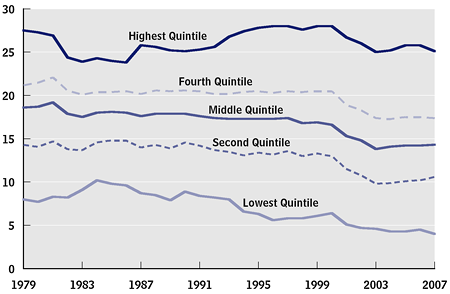
Federal taxes are progressive: Average federal tax rates generally rise with income. In 2007 (the most recent year for which data are available), households in the bottom fifth, or quintile, of the income distribution (with average income of $18,400, under a broad definition of income) paid about 4 percent of their income in federal taxes, while the middle quintile, with average income of $64,500, paid 14 percent, and the highest quintile, with average income of $264,700, paid 25 percent. Between 1979 and 2007, average tax rates declined, on balance, for households in each quintile of the income distribution (see the figure below).
| Average Federal Tax Rates, by Income Quintile, 1979 to 2007 (percent) |
 |
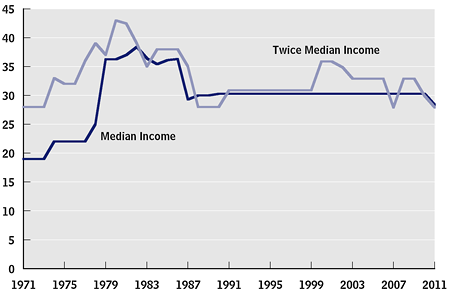
One measure of the effect of taxes on the returns from working and saving is the marginal tax rate—the tax paid per dollar of extra earnings or dollar of extra income from savings. For a representative family of four with median income, the marginal tax rate on earnings (combining the rates for both federal income and payroll taxes) 40 years ago was around 20 percent. That rate climbed over the next 10 years as a result of rising payroll tax rates and inflation-driven increases in nominal incomes, which pushed median-income families into higher tax brackets (see the figure below). Following a reduction in income tax rates in 1986, the marginal tax rate for a representative median-income family has remained at about 30 percent (the rate is 2 percentage points lower in 2011 with the temporary reduction in the payroll tax rate). The marginal tax rate on income from savings has also fallen, on balance, over the past 40 years owing to reductions in statutory tax rates on overall taxable income as well as separate reductions in the tax rates that apply to income from capital gains and dividends.
| Marginal Tax Rates (Income and Payroll) on Earnings for a Family of Four with a Single Earner, 1971 to 2011 (Percent) |
 |