
This report describes the Congressional Budget Office’s current view of the economy over the next two years, compares that view with projections of other forecasters and with those that CBO made previously, and explains the implications for the federal budget. CBO’s current view of the economy incorporates information available through November 16, 2022; the agency’s most recent projections, published in May 2022, used information available through March 2, 2022.
According to CBO’s current assessment, economic growth will probably be slower in 2023 than the agency projected in May 2022, reflecting recent developments (including higher interest rates), and faster in 2024, as the economy recovers. Rates of unemployment, inflation, and interest will probably be higher over the next two years than CBO projected in May 2022. Slower economic growth and higher rates of unemployment, inflation, and interest increase federal deficits and debt.
CBO will publish its budget and economic projections early next year in the agency’s annual Budget and Economic Outlook.1 As part of the process of preparing that report, CBO is in the midst of revising its economic forecast. The agency is providing information in this report now in response to interest expressed by Members of Congress. The report is more comprehensive than would have been possible if CBO’s standard process for developing its forecast had not already been underway.
Because CBO has not completed its forecast, this analysis focuses on the middle two-thirds of ranges for economic projections that indicate uncertainty about the possible outcomes for output, unemployment, inflation, and interest rates. (For a description of the analytic methods used in this report, see Box 1.) The forecast published early next year will include point estimates.
Output
From the fourth quarter of 2022 to the fourth quarter of 2023, CBO estimates, there is a two-thirds chance that growth in economic output—specifically, gross domestic product adjusted to remove the effects of inflation, or real GDP—will be between −2.0 percent and 1.8 percent (see Table 1). For 2024, that estimate ranges from 0.7 percent to 4.2 percent.
Table 1.
Real GDP and Unemployment Rate Projections
Percent

Data sources: Congressional Budget Office; Federal Reserve Bank of Philadelphia, “Fourth Quarter 2022 Survey of Professional Forecasters” (November 14, 2022), https://tinyurl.com/3ftuwcf7; Board of Governors of the Federal Reserve System, “Table 1. Economic Projections of Federal Reserve Board Members and Federal Reserve Bank Presidents, Under Their Individual Assumptions of Projected Appropriate Monetary Policy, September 2022” (September 21, 2022), https://tinyurl.com/ycx5pchd; Congressional Budget Office, The Budget and Economic Outlook: 2022 to 2032 (supplemental data, May 2022), www.cbo.gov/publication/57950#data.
Change in real GDP is measured in the fourth quarter of the year indicated relative to the fourth quarter of the previous year. The unemployment rate is measured in the fourth quarter of the year. Real values are nominal values that have been adjusted to remove the effects of changes in prices.
a. The unemployment rate is the number of people not working who are available for work and are either seeking work or expecting to be recalled from a temporary layoff, expressed as a percentage of the labor force.
b. CBO estimates that there is a roughly two-thirds chance that the actual value will fall within the range shown. The agency plans to publish a new baseline, showing point estimates, early in 2023, updating its most recent baseline, which was published in May 2022.
c. Values for the Survey of Professional Forecasters are the middle two-thirds of the full range—which is formed by removing the highest and lowest one-sixth of the projections. For example, 38 forecasters reported real GDP growth in the survey, and the 6 highest and 6 lowest estimates were removed.
d. Values for the Federal Reserve are the central tendency—which is, roughly speaking, the middle two-thirds of the full range, formed by removing the 3 highest and 3 lowest of the 16 projections by the Board of Governors and the presidents of the Federal Reserve Banks.
GDP = gross domestic product; n.a. = not available.
For 2023, CBO expects that real GDP growth is more likely to be below than above the estimates of other forecasters—namely, the ranges spanned by the middle two-thirds of projections in the Survey of Professional Forecasters and the central tendency (roughly the middle two-thirds) of estimates by Federal Reserve officials. For 2024, CBO expects that such growth is more likely to be above the Federal Reserve’s central tendency than below it.
The forecasts from the Survey of Professional Forecasters were published in November 2022, and those by the Federal Reserve were published in September 2022. Part of the difference between CBO’s projections and those of other forecasters is attributable to differences in the economic data available when the forecasts were completed and to differences in the economic and statistical models used to prepare them.2
CBO now expects real GDP growth in 2023 to be less than the rate of 2.2 percent it projected in May 2022—specifically, such growth is more likely to be below the most recent baseline projection than above it. The revision reflects the data available so far for 2022: Actual growth has been much slower than CBO had projected, and increases in interest rates by the Federal Reserve have been much greater than CBO had projected, along with other factors. The agency expects real GDP growth in 2024 to be greater than the rate it projected in May 2022, as the economy recovers from slow growth in 2022 and 2023.
Unemployment
For the fourth quarter of 2023, CBO estimates that there is a two-thirds chance that the unemployment rate will be between 3.8 percent and 6.4 percent (see Table 1). For the fourth quarter of 2024, that estimate ranges from 3.2 percent to 6.4 percent.
The unemployment rate, CBO currently expects, is more likely to be above the ranges of projections from the Survey of Professional Forecasters and the Federal Reserve than below them. Differences may be attributable to the data available in each case and the modeling frameworks.
CBO expects the unemployment rate in 2023 and 2024 to be greater than the rate the agency projected in May 2022. The revision stems mainly from the estimate of slower economic growth in 2023.
Inflation
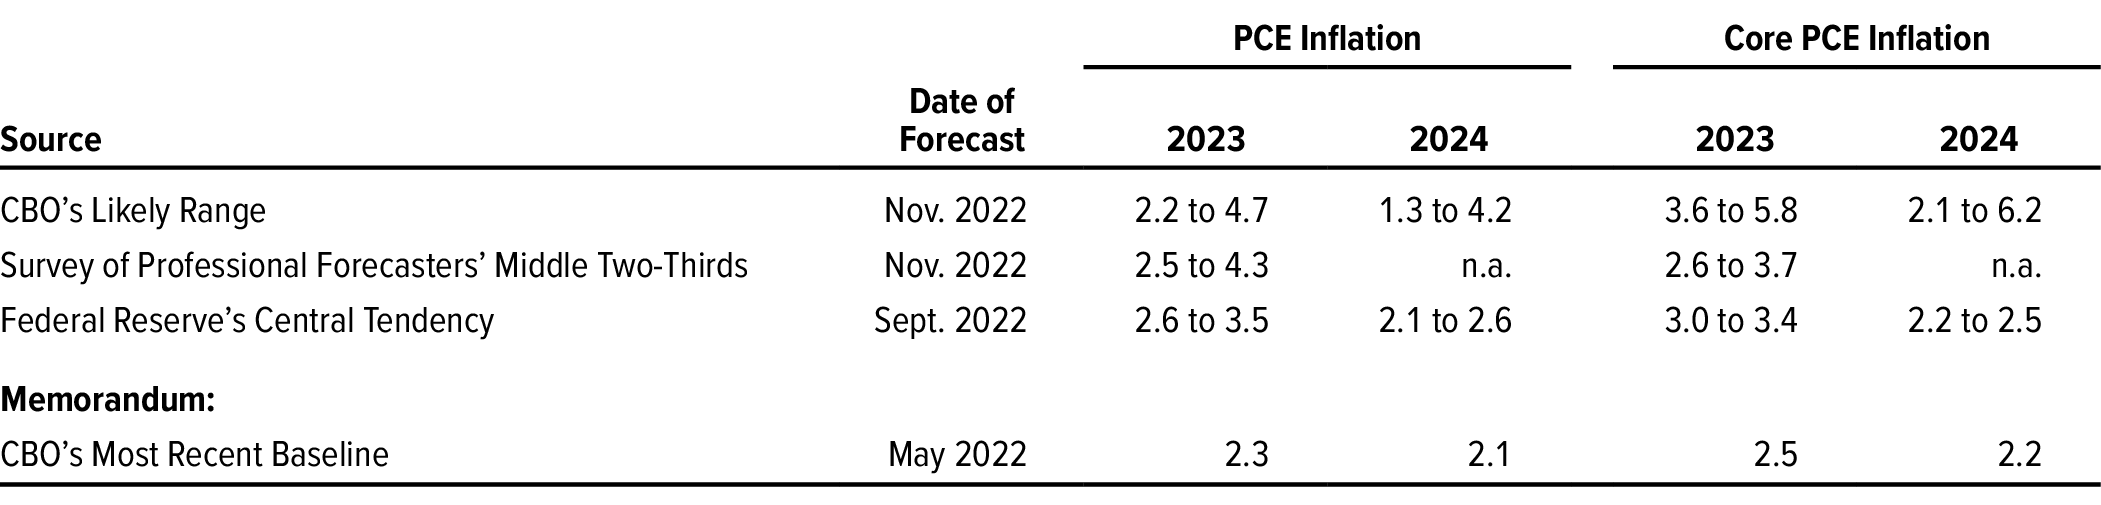
For 2023, CBO estimates that there is a two-thirds chance that the rate of inflation—specifically, that measured by the change in the personal consumption expenditures, or PCE, price index from the fourth quarter of 2022 to the fourth quarter of 2023—will be between 1.8 percent and 4.6 percent (see Table 2). For 2024, that estimate ranges from 1.1 percent to 3.6 percent. Inflation as measured by the core PCE price index, which removes food and energy prices and is less volatile, is likely to be above the estimates for the PCE price index in both years.
Table 2.
Inflation Projections
Percent
Data sources: Congressional Budget Office; Federal Reserve Bank of Philadelphia, “Fourth Quarter 2022 Survey of Professional Forecasters” (November 14, 2022), https://tinyurl.com/3ftuwcf7; Board of Governors of the Federal Reserve System, “Table 1. Economic Projections of Federal Reserve Board Members and Federal Reserve Bank Presidents, Under Their Individual Assumptions of Projected Appropriate Monetary Policy, September 2022” (September 21, 2022), https://tinyurl.com/ycx5pchd; Congressional Budget Office, The Budget and Economic Outlook: 2022 to 2032 (supplemental data, May 2022), www.cbo.gov/publication/57950#data.
Inflation is measured as the change in the price index in the fourth quarter of the year indicated relative to the fourth quarter of the previous year. Core PCE inflation excludes prices for food and energy.
For definitions of CBO’s likely range, the Survey of Professional Forecasters’ middle two-thirds, and the Federal Reserve’s central tendency, see the notes to Table 1.
PCE = personal consumption expenditures; n.a. = not available.
The PCE inflation rate, by CBO’s current expectations, is about as likely to be above the ranges of projections from the Survey of Professional Forecasters and the Federal Reserve as below them. The core PCE inflation rate is more likely to be above the range of projections from the Survey of Professional Forecasters for 2023 than below it. Compared with the projections from the Federal Reserve, that rate is about as likely to be above the range from the central bank as below it for 2023 and more likely to be above that range than below it for 2024, CBO expects. Differences may be attributable to the data available in each case and the modeling frameworks.
CBO expects the PCE and core PCE inflation rates in 2023 and 2024 to be greater than the rates the agency projected in May 2022. The revisions stem mainly from stronger growth in the prices of housing and other services than projected previously.
Interest Rates
For 2023, CBO estimates that there is a two-thirds chance that the annual average of interest rates on three-month Treasury bills will be between 3.4 percent and 5.6 percent (see Table 3). For 2024, that estimate ranges from 1.7 percent to 4.8 percent. There is a two-thirds chance that the federal funds rate—the rate that financial institutions charge each other for overnight loans—will be between 2.7 percent and 6.8 percent in the fourth quarter of 2023 and between 0.6 percent and 4.6 percent in the fourth quarter of 2024.
Table 3.
Interest Rate Projections
Percent

Data sources: Congressional Budget Office; Federal Reserve Bank of Philadelphia, “Fourth Quarter 2022 Survey of Professional Forecasters” (November 14, 2022), https://tinyurl.com/3ftuwcf7; Board of Governors of the Federal Reserve System, “Table 1. Economic Projections of Federal Reserve Board Members and Federal Reserve Bank Presidents, Under Their Individual Assumptions of Projected Appropriate Monetary Policy, September 2022” (September 21, 2022), https://tinyurl.com/ycx5pchd; Congressional Budget Office, The Budget and Economic Outlook: 2022 to 2032 (supplemental data, May 2022), www.cbo.gov/publication/57950#data.
For definitions of CBO’s likely range, the Survey of Professional Forecasters’ middle two-thirds, and the Federal Reserve’s central tendency, see the notes to Table 1.
a. Three-month Treasury bill rates are annual averages.
b. The federal funds rate is the interest rate that financial institutions charge each other for overnight loans. The Federal Reserve officials’ forecasts of the federal funds rate are for the rate at the end of the year, whereas CBO’s projections are fourth-quarter values.
n.a. = not available.
For 2023, interest rates on three-month Treasury bills and the federal funds rate, according to CBO’s current expectations, are about as likely to be above the ranges of projections from the Survey of Professional Forecasters and the Federal Reserve as below them. For 2024, those interest rates are more likely to be below the ranges of projections from the Survey of Professional Forecasters and the Federal Reserve than above them. Again, differences may be attributable to the data available in each case and the modeling frameworks.
CBO expects interest rates on three-month Treasury bills and the federal funds rate to be higher in 2023 and 2024 than the rates the agency projected in May 2022. The federal funds rate in 2024, in particular, is more likely to be above the most recent baseline projection than below it; within the middle two-thirds range from 0.6 percent to 4.6 percent, the rate is more likely to be above the rate of 2.6 percent projected in May 2022 than below it, CBO estimates. The revisions, which incorporate the historical relationship between the two rates, stem mainly from greater increases in 2022 in the federal funds rate set by the Federal Reserve and in inflation than CBO had projected.
Effects of the Economy on the Federal Budget
To assess the implications of its current view of the economy for budget estimates and to indicate uncertainty about the possible outcomes, CBO began by generating 100 simulations of economic conditions over the next two years centered on its current economic projections. CBO then made rough estimates of how its May 2022 baseline budget projections would have differed if the agency had used each simulation as its economic forecast (see Box 1).
Box 1.
CBO’s Analytic Methods
This report’s description of the Congressional Budget Office’s current view of economic conditions and its budgetary implications—including estimates of the middle two-thirds ranges of economic and budget outcomes, indicating uncertainty—is based on an analysis that was conducted in four main steps:
- A preliminary version of CBO’s economic forecast provides central estimates of 26 variables used for budget analysis;
- 100 simulations of the rates of unemployment, inflation, and interest are jointly estimated around the central estimates;
- Forecasts conditional on those rates are estimated for the remaining economic variables in each simulation; and
- Rough estimates of differences in budget projections relative to CBO’s May 2022 baseline are generated for each simulation.
For a description of the methods used to develop the preliminary version of CBO’s forecast, see Robert W. Arnold, How CBO Produces Its 10-Year Economic Forecast, Working Paper 2018-02 (Congressional Budget Office, February 2018), www.cbo.gov/publication/53537.
The simulations of the rates of unemployment, inflation, and interest are estimated using an expanded version of CBO’s model that follows a switching process in which the unemployment rate rises rapidly in some periods and falls gradually in others and interest rates do not fall below zero. For a description of an earlier version of that model focused on the unemployment rate, see Michael McGrane, A Markov- Switching Model of the Unemployment Rate, Working Paper 2022-05 (Congressional Budget Office, March 2022), www.cbo.gov/publication/57582.
The variables in the expanded Markov-switching model have a distribution of deviations from the central estimates similar to CBO’s historical forecasting errors, reflecting asymmetric dynamics, and are related through an expectations-augmented Phillips curve and an inertial Taylor rule. For a description of those relationships in a related model, see Mark Lasky, The Congressional Budget Office’s Small-Scale Policy Model, Working Paper 2022-08 (Congressional Budget Office, September 2022), www.cbo.gov/publication/57254.
For a description of earlier related analysis of likely ranges, see Congressional Budget Office, The Budget and Economic Outlook: 2022 to 2032 (May 2022), www.cbo.gov/ publication/57950. There, simulations of unemployment rates underlie the results in Table 2-4, and CBO’s historical forecasting errors underlie the results in Figure 2-7.
Most of the economic variables in the simulations are produced using a conditional forecasting approach in which the paths of economic output and other variables are synchronized—using symmetric distributions—with the simulations of unemployment, inflation, and interest rates. For a discussion of that approach and how it connects to the method used for budget analysis, see CBO’s Economic Scenarios and Budgetary Implications Team, Budgetary Implications of Economic Scenarios With Higher and Lower Interest Rates, Working Paper 2022-04 (Congressional Budget Office, March 2022), www.cbo.gov/publication/57908. The analysis presented in this report differs from the one described in that working paper by centering its simulations on a preliminary version of CBO’s economic forecast instead of using projections by Blue Chip forecasters.
For details about the method of budget analysis, see Nathaniel Frentz, Jaeger Nelson, Dan Ready, and John Seliski, A Simplified Model of How Macroeconomic Changes Affect the Federal Budget, Working Paper 2020-01 (Congressional Budget Office, January 2020), www.cbo.gov/publication/55884.
This analysis did not include estimates stemming from legislative or technical changes to the budget projections. Those legislative and technical effects, which have often been larger than the economic effects, will be included when CBO updates its budget projections early next year. In that update, the agency will incorporate the details of its economic forecast into its budget projections by considering each spending account in the budget and each revenue provision in effect. That method captures the effects of numerous factors, such as changes in asset values, that are not reflected in the rough estimates included in this report.
Analysis using the 100 simulations of economic conditions finds that if any one of them had been used as the forecast underlying CBO’s baseline budget projections in May 2022 rather than the forecast used at that time, the federal deficit would almost surely have been greater. In the middle two-thirds of the cases, the May 2022 baseline projections would have differed in the following ways:
- For fiscal year 2023, the deficit would have been larger by between $200 billion and $300 billion, or between 20 percent and 30 percent, and
- For fiscal year 2024, it would have been larger by between $210 billion and $480 billion, or between 20 percent and 46 percent.
Increases in net interest costs in almost every case are the primary contributor to greater deficits. The effects on revenues and noninterest spending also contributed to greater deficits in most cases.
Likewise, in the middle two-thirds of the cases, federal debt held by the public in the May 2022 baseline projections would have been the following:
- At the end of fiscal year 2023, such debt would have been between 0.2 percent of GDP and 2.8 percent of GDP higher than the 96.0 percent of GDP projected most recently, and
- At the end of fiscal year 2024, it would have been between 0.3 percent of GDP and 6.0 percent of GDP higher than the 96.1 percent of GDP projected most recently.
In most simulations, the growth in the dollar amount of debt is accompanied by an increase in the amount of nominal GDP, in part reflecting inflation.
Corrections
The Congressional Budget Office has corrected this report since its original publication. Both the PDF and online versions were corrected, but for ease of reference, this list indicates the location of the corrections in the PDF.
The following changes were made on December 14, 2022:
Page 3, Table 2, both ranges for 2023 values from the Survey of Professional Forecasters’ middle two-thirds were corrected.
1. For earlier volumes in the series, see Congressional Budget Office, “Budget and Economic Outlook and Updates” (accessed November 30, 2022), www.cbo.gov/about/products/major-recurring-reports#1. CBO’s most recent projections from May 2022 underlie the baseline that will be used in cost estimates for legislation at least through the end of 2022.
2. A key difference between CBO’s economic projections and those made by Federal Reserve officials is that CBO develops its projections so that they fall in the middle of the range of likely outcomes under current law, whereas the Federal Reserve reports a different concept: Federal Reserve officials provide modal forecasts—forecasts of the most likely outcomes—reflecting their individual assessments of appropriate monetary policy, and the Federal Reserve reports ranges of those modal values. In addition, Federal Reserve officials and other forecasters, unlike CBO, may assume in their forecasts that additional legislation will be enacted.
The Congressional Budget Office prepared this report in response to interest expressed by Members of Congress. In keeping with CBO’s mandate to provide objective, impartial analysis, the report makes no recommendations.
Robert Arnold, Aaron Betz, Devrim Demirel, Nathaniel Frentz, Edward Gamber, Jeffrey Kling, Mark Lasky, Avi Lerner, Chandler Lester, Michael McGrane, Jaeger Nelson, Dan Ready, Jeffrey Schafer, John Seliski, Matthew Wilson, and Byoung Hark Yoo prepared the report with guidance from Richard DeKaser and Sebastien Gay. Leigh Angres, Christina Hawley Anthony, Michael Falkenheim, Theresa Gullo, Joseph Kile, Deborah Kilroe, Leo Lex, John McClelland, and Sam Papenfuss offered comments.
Mark Doms, Mark Hadley, and Robert Sunshine reviewed the report. John Skeen edited it, and Jorge Salazar prepared it for publication. The report is available at www.cbo.gov/publication/58757.
CBO seeks feedback to make its work as useful as possible. Please send comments to communications@cbo.gov.

Phillip L. Swagel
Director